
Case study based on Transfer Learning from US and UK
Current Covid scenario globally
The novel coronavirus disease (COVID-19) has threatened public health on various levels worldwide. Because of the unpredictable outbreak nature and the virus’s pandemic intensity, people are experiencing depression, anxiety, and other strain reactions. We have now experienced various periods of the Virus in different countries ranging from the first to the third wave. It has become imperative to know early on in the diagnosis about the progression of the active cases and the effect of vaccination.

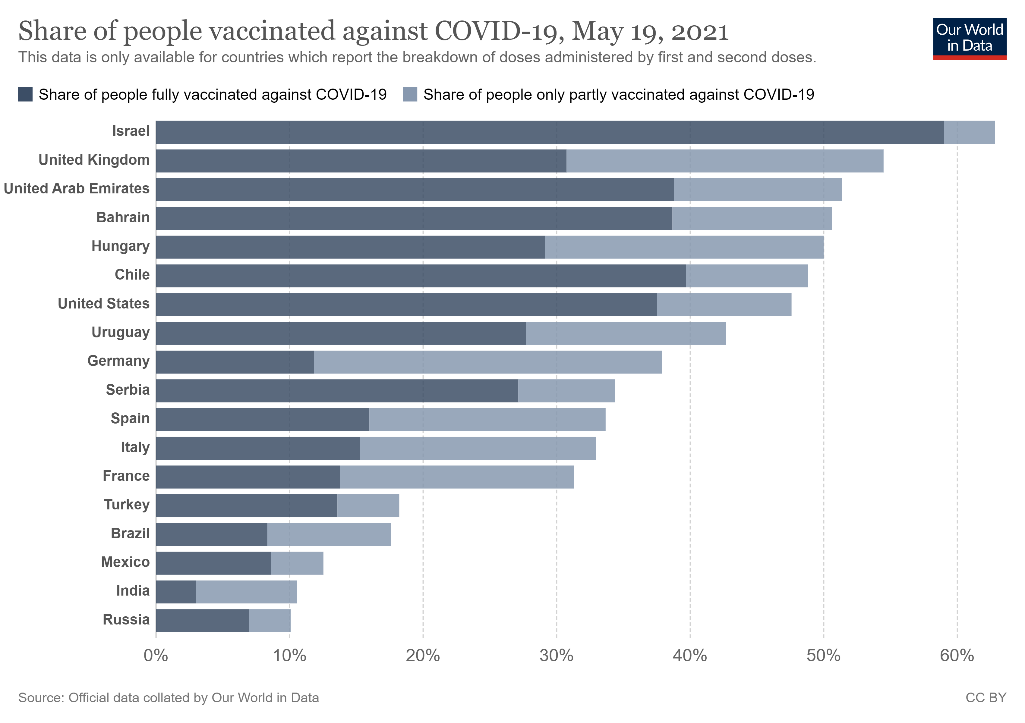
While some countries have seen the incremental cases coming down significantly backed by either the positive benefits of the herd immunity or mainly led by the Vaccination trends. Many countries have seen significant penetration of vaccination in their population including US, UK, UAE, Israel, Bahrain etc ranging from 30 to 60% of total population.
Therefore, it is essential for safety and prevention purposes to promptly predict and forecast the virus control based on vaccination trends in the population.
Predicting Daily New Cases in India
In this article, we attempt to predict virus containment wrt. vaccination trends in a country like India which is currently facing the biggest brunt of the virus by using a Transfer Learning approach from countries like US and UK who have done significant penetration in vaccination and have encouraging results in the containment. We thus, predict India’s likely active cases over the next six to seven months when India is likely to achieve a large portion of vaccination based on the supply assumptions.
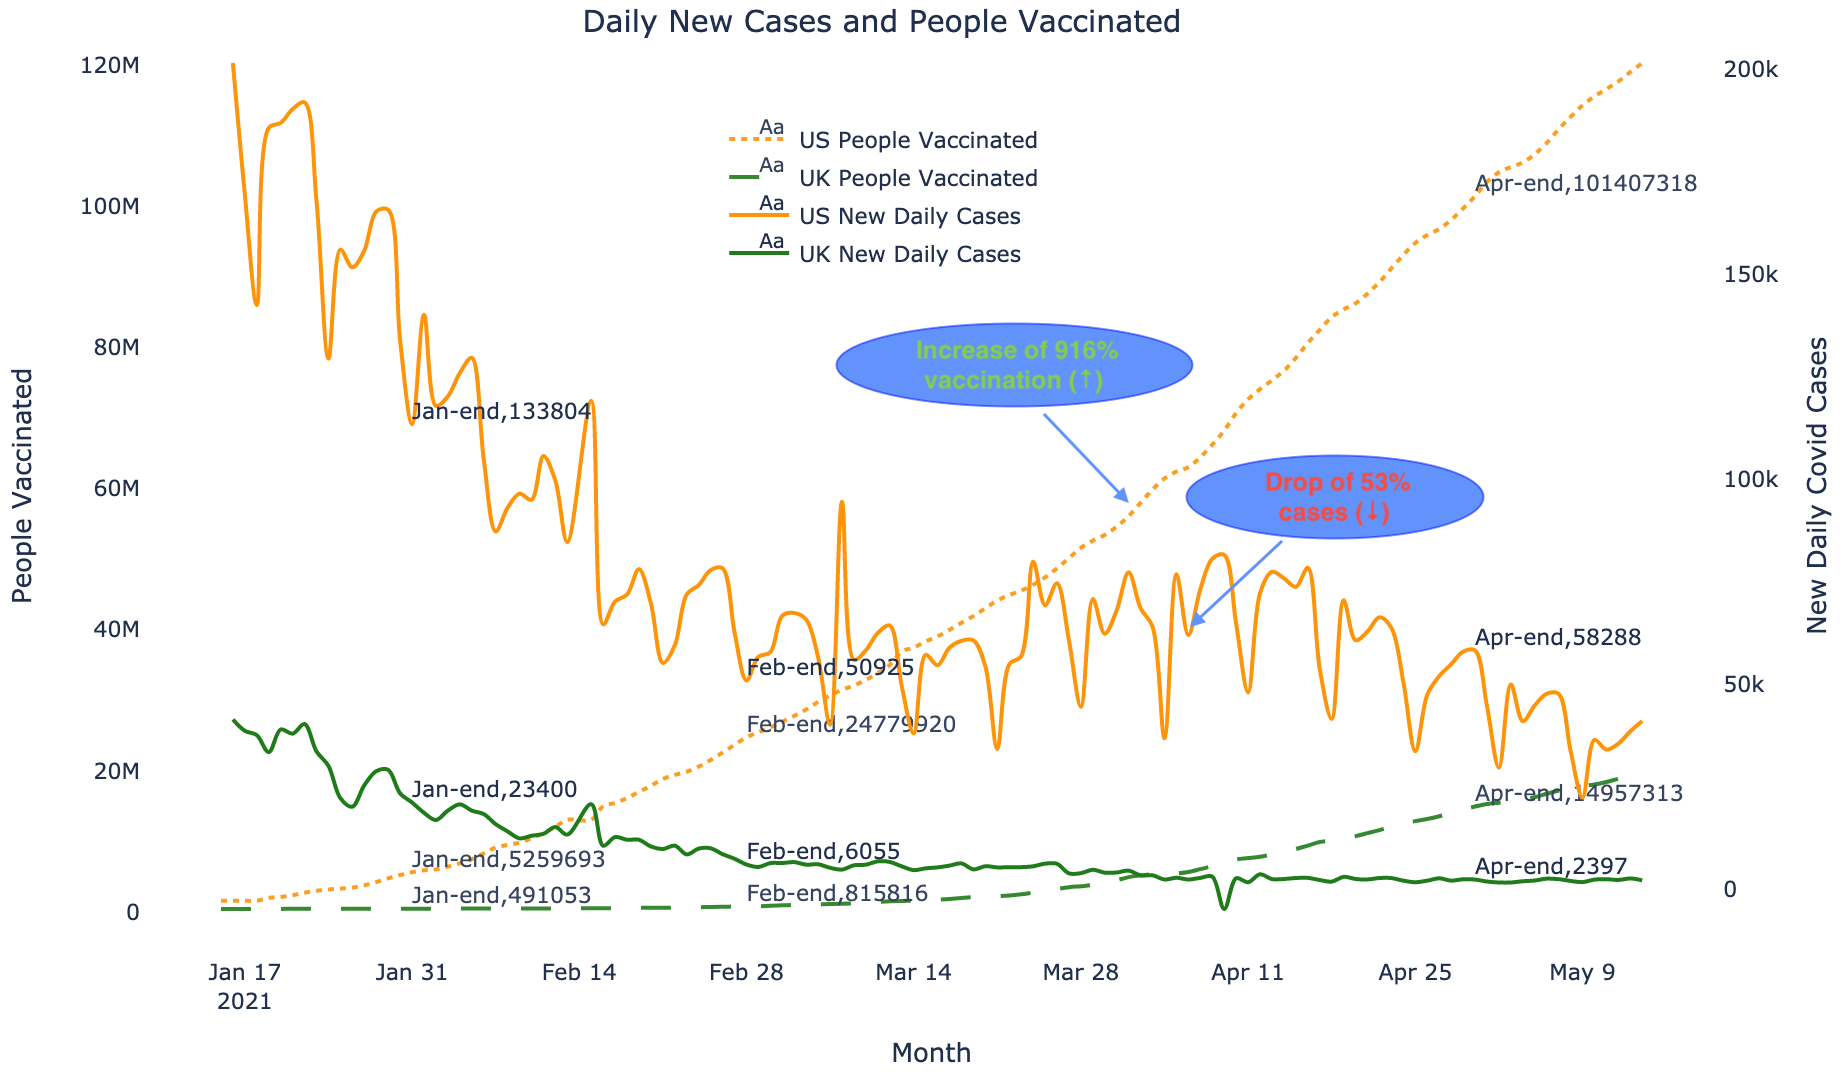
The approach is applying a time series based ARIMA (Auto-Regressive Integrated Moving Average) model to predict the number of cases for the next coming months based on Vaccination Trends and Transfer Learning approach. The process of learning part of the parameters from one data set and applying it to another data set is known as Transfer Learning. As various countries like the UK and USA are in different stages of vaccination and virus cases dropped significantly in those countries, this gives us an opportunity to learn from the data to project new cases in India.
ARIMA has three components – AR (Autoregressive Term), I (Differencing Term) and MA (Moving Average Term).
AR term refers to the past values used for forecasting the next value. The AR term is defined by the parameter ‘p’ in ARIMA.
MA term is used to define the number of past forecast errors used to predict the future values. The parameter ‘q’ in ARIMA represents the MA term.
Order of differencing specifies the number of times the differencing operation is performed on series to make it stationary. Test like ADF (Augmented Dickey Fuller Test) are used to determine whether the series is stationary and help in identifying the d value.
Method:
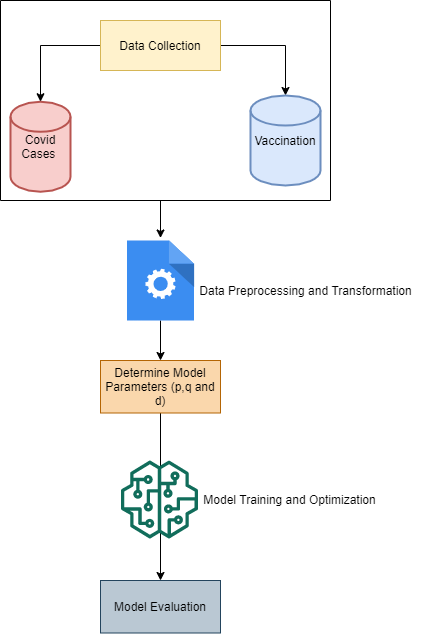
The proposed system forecasts the number of confirmed cases of COVID-19. This includes data collection, data preprocessing, data splitting, model training and optimization, and finally the model evaluation.
Data Collection:
The data has been drawn from “Our World in Data” and consists of the necessary information regarding the COVID cases and Vaccination data. Dataset includes daily-level information of the number of confirmed cases and number of vaccinations (Total, Ist Dose, IInd Dose etc.).
Data Preprocessing:
We checked the stationarity of the time series and performed the required transformation, interpolated the values where data is missing, normalization and standardization using log (as values of the time series are increasing exponentially for vaccination as well as cases).
Determine Model Parameters
For determining the model parameters, we took USA and UK covid and vaccination data as the base of transfer learning. Using these, we identified the right transformation and one of the parameters of the ARIMA model namely the Degree of differencing (d) is obtained from here. For differencing, we tried d=1,2,3 and found the log transformation with single differencing (d=1) makes the data stationary for the UK and USA. Other parameters, ie. Auto-regression period (p) and Moving average period (q) are obtained from India data based on the best fit.
Model Training and Optimization
Using the processed data and optimised parameter values p,d,q we calculated from the previous steps, we fit the ARIMA model. The final model parameters are (3,1,0).
Model Evaluation
For measuring models’ performance, the following errors were used to estimate the forecasting precision of the models such as RMSE (Root mean square error), MAE (Mean absolute error) and MAPE (Mean absolute percentage error).
Experimental Results
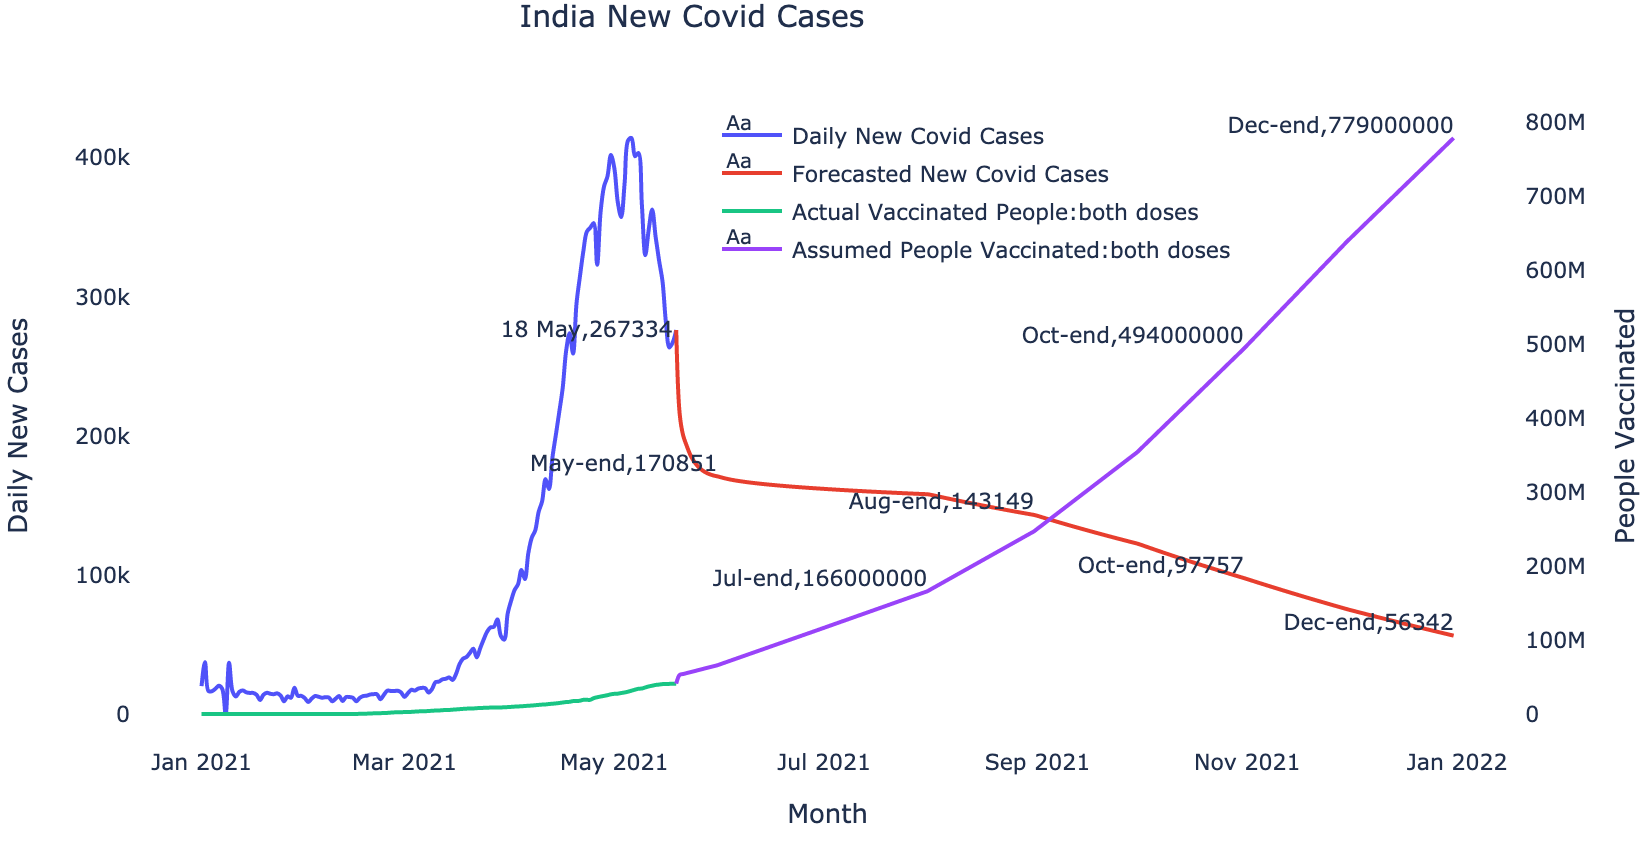
| Date | Daily New Cases (Model forecast) | Total Vaccinated Population (Projected) |
| 2021-05-31 | 170,851 | 6,60,00,000 |
| 2021-06-30 | 162,036 | 11,50,00,000 |
| 2021-07-31 | 158,019 | 16,60,00,000 |
| 2021-08-31 | 143,149 | 24,70,00,000 |
| 2021-09-30 | 122,549 | 35,40,00,000 |
| 2021-10-31 | 97,757 | 49,40,00,000 |
| 2021-11-30 | 75,381 | 63,90,00,000 |
| 2021-12-31 | 56,342 | 77,90,00,000 |
Conclusion
As can be seen from the Predictive modeling, the Vaccination approach has a very significant correlation with the likely containment of the Virus in India based on Global trends in US and UK. Thus, it is imperative for the Governments to speeden up the supply and make vaccination a must for the entire populous of India. Whilst there may be various new waves and strains of virus coming as we go along, the impact and gravity of impact is likely to come down in any case. The disclaimers of the model approach being the correctness of the data and hoping new strains being contained by the existing vaccines in supply. A similar modeling approach can be created for predicting daily new cases in other countries.
This article is purely for illustrating data analysis and machine learning techniques and should not be used for serious decision making.
Follow