
An overview of clustering in analytics
Just as the name suggests, clustering aims at creating clusters of the subject matter at hand, based on the various properties it possesses. This can be pretty useful when it comes to classifying elements in the future, into one of these clusters or in terms of establishing patterns in the data. It gives us a better idea as to what information our data might want to relay to us.
Consider a case where a product based organization needs to better understand its customers so that it can market the products to them better, an ideal scenario where the company needs to look at customer data and identify patterns within it. And by clustering the consumers into different sets based on their properties, the company will have a much clearer picture in terms of what products to market to what customers and how.
There are many ways of clustering data and based on those ways, a lot of methods have been defined. Since the ways in which clustering is performed can impact results, different methods are applicable to different situations and maybe more suitable to a given scenario than the rest.
Conceptually, clusters are created in three different ways :
Flat or partitioning clustering : Datasets are directly divided into various clusters, example : K-means clustering.
Hierarchical clustering : Involves creating one cluster and then dividing that cluster into two similar clusters and so on. Another way is by creating n clusters for n data points and then by computing similarities between them, creating bigger clusters by combining those clusters.
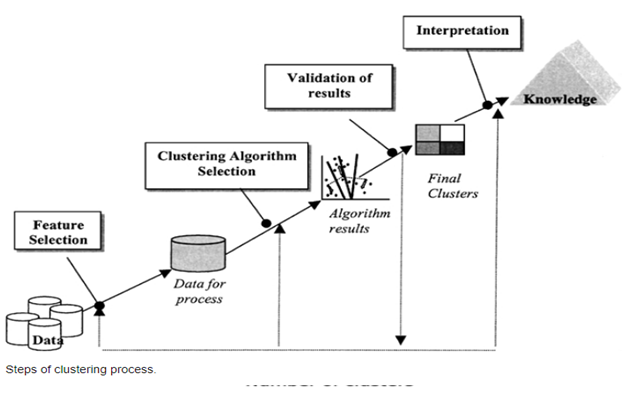
As with every technique in data science, data has to be pre-processed and cleaned before any techniques can be applied to it. After that, selecting relevant features is really important as those will form the basis of our clustering.
An important choice to make before starting the process of clustering is to decide how many clusters should be made. There are various ways to find that out but a more popular and reliable method is the elbow method. This method involves running the clustering algorithm in a loop with different number of clusters at every iteration and then plotting the sum of squared errors for each of those iterations.
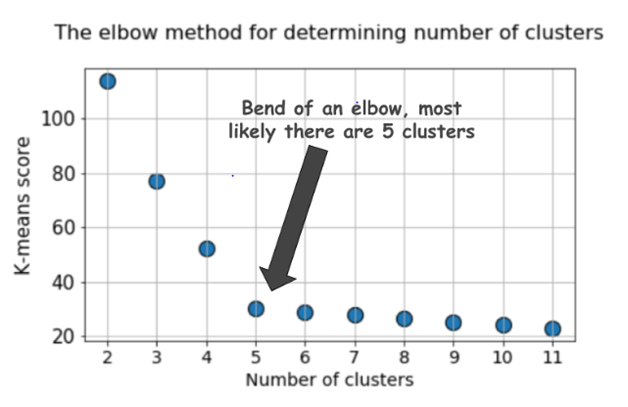
And as per the elbow method, if the plot looks like an arm, the number of clusters used at the elbow of the arm, in other words, the point on the plot after which the sum of squared errors tend to increase, are the ideal number of clusters that should be made.
Finally, after the clusters have been made, we can analyze the properties belonging to each of them and draw conclusions based on those.
Follow