Business intelligence (BI) comprises various strategies and technologies used by enterprises for the data analysis of business information. BI technologies provide historical, current, and predictive views of business operations. Common functions of business intelligence technologies include ETL, online analytical processing, analytics, dashboard development, data mining, process mining, complex event processing, business, benchmarking, text mining, predictive analytics, and prescriptive analytics and reporting. BI technologies can handle large amounts of structured and sometimes unstructured data to help identify, develop, and otherwise create new strategic business opportunities.

Databases and ETL
Database technologies take information and store, organize, and process it in a way that enables users to easily and intuitively go back and find details they are searching for. Database technologies come in all shapes and sizes, from complex to simple, large to small. It’s important to know how these database technologies will be used as the size of your data grows, as well as how it will interact with any software.
The data over which BI tasks are performed often comes from different sources typically from multiple operational databases (such as MySQL, MongoDB, PostgreSQL, SQLServer, spreadsheets etc.) across departments within the organization, as well as external vendors. Different sources contain data of varying quality, use inconsistent representations, codes, and formats, which have to be reconciled. Thus, the problems of integrating, cleansing, and standardizing data in preparation for BI tasks can be rather challenging. Efficient data loading is imperative for BI. Moreover, BI tasks usually need to be performed incrementally as new data arrives, for example, last month’s sales data. This makes efficient and scalable data loading and refresh capabilities imperative for enterprise BI.
The back-end technologies for preparing the data for BI are collectively referred to as Extract-Transform-Load (ETL) tools. It is a process of extracting data from different data sources; manipulating them according to business calculations; loading the modified data into a different data warehouse. Because of the in-depth analytics data it provides, ETL function lies at the core of Business Intelligence systems. With ETL, enterprises can obtain historical, current, and predictive views of real business data.
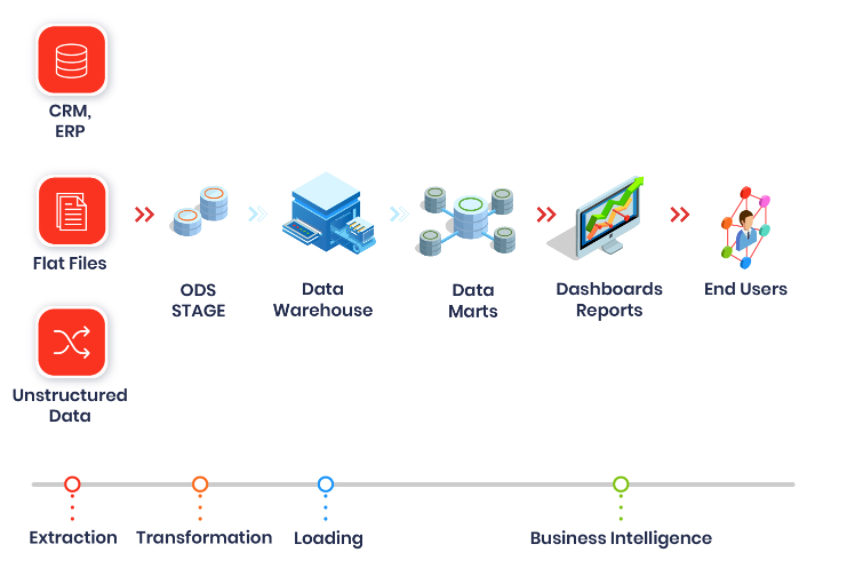
The following are the features/modules of ETL process:
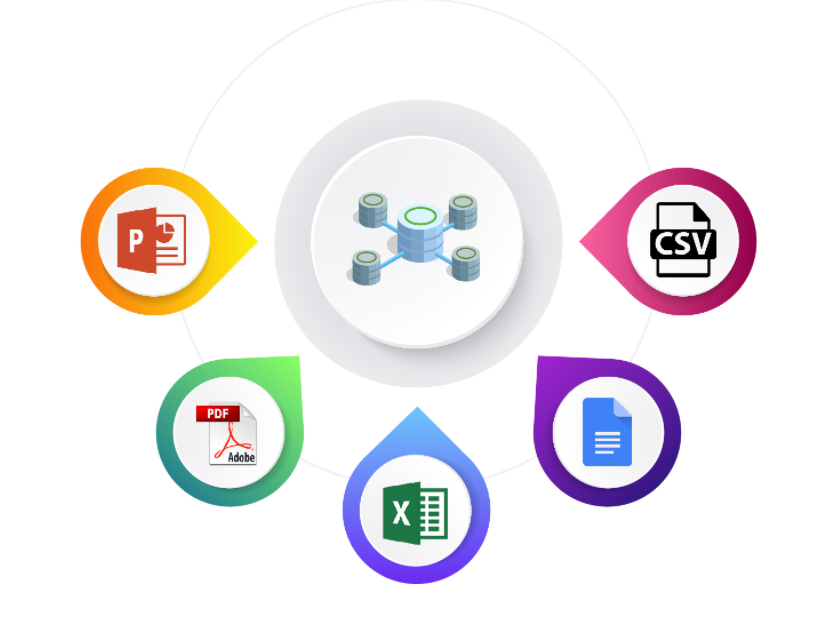
1. Extraction: This module extracts data from different data sources independent of file formats. For Instance, banking and insurance technology platforms operate on different databases, hardware, operating systems, and communication protocols. Also, their system derives data from a variety of touchpoints like ATMs, text files, pdfs, spreadsheets, scanned forms, etc. The extraction phase maps the data from different sources into a unified format before processing.
2. Transformation: This stage involves applying algorithms and modifying data according to business-specific rules. The common operations performed in ETL’s transformation stage are computation, concatenation, filters, and string operations like currency, time, data format, etc. It also includes data cleaning like removing null values, data standardization etc.
3.Load: Loading is a process of migrating structured data into the warehouse. Usually, large volumes of data need to be loaded in a short time. ETL applications play a crucial role in optimizing the load process with efficient recovery mechanisms for the instances of loading failures.

The end-to-end BI pipeline also requires usage of SQL and Python. Data analysts use SQL to perform ETL tasks within a relational database. SQL is especially useful when the data source and destination are the same type of database. Python is a general purpose programming language but It has become a popular tool for performing ETL tasks due to its ease of use and extensive libraries for accessing databases and storage technologies. Python can be also used instead of ETL tools for ETL tasks.
Data Visualization and Dashboards
Dashboards are informative, easily readable, usually one page, real-time user interface that shows a visual representation of data using graphs and charts. Dashboards are real time, as when they are pulled up on a web page which is linked to the database the data shown on the dashboard is constantly updated and refreshed. Dashboards show summaries, key trends, comparisons, and insights in both current and historical data. This will help to see at a glance the performance and status of different parts of an organization and to make informed business decisions.
Narrator which is an end-to-end fully automated BI solutioning tool provides smart visualisation and dashboard formats. The top-most useful insights in graphical dashboards helps senior management, sales and marketing to take actionable insights.
Narrator Dashboard:
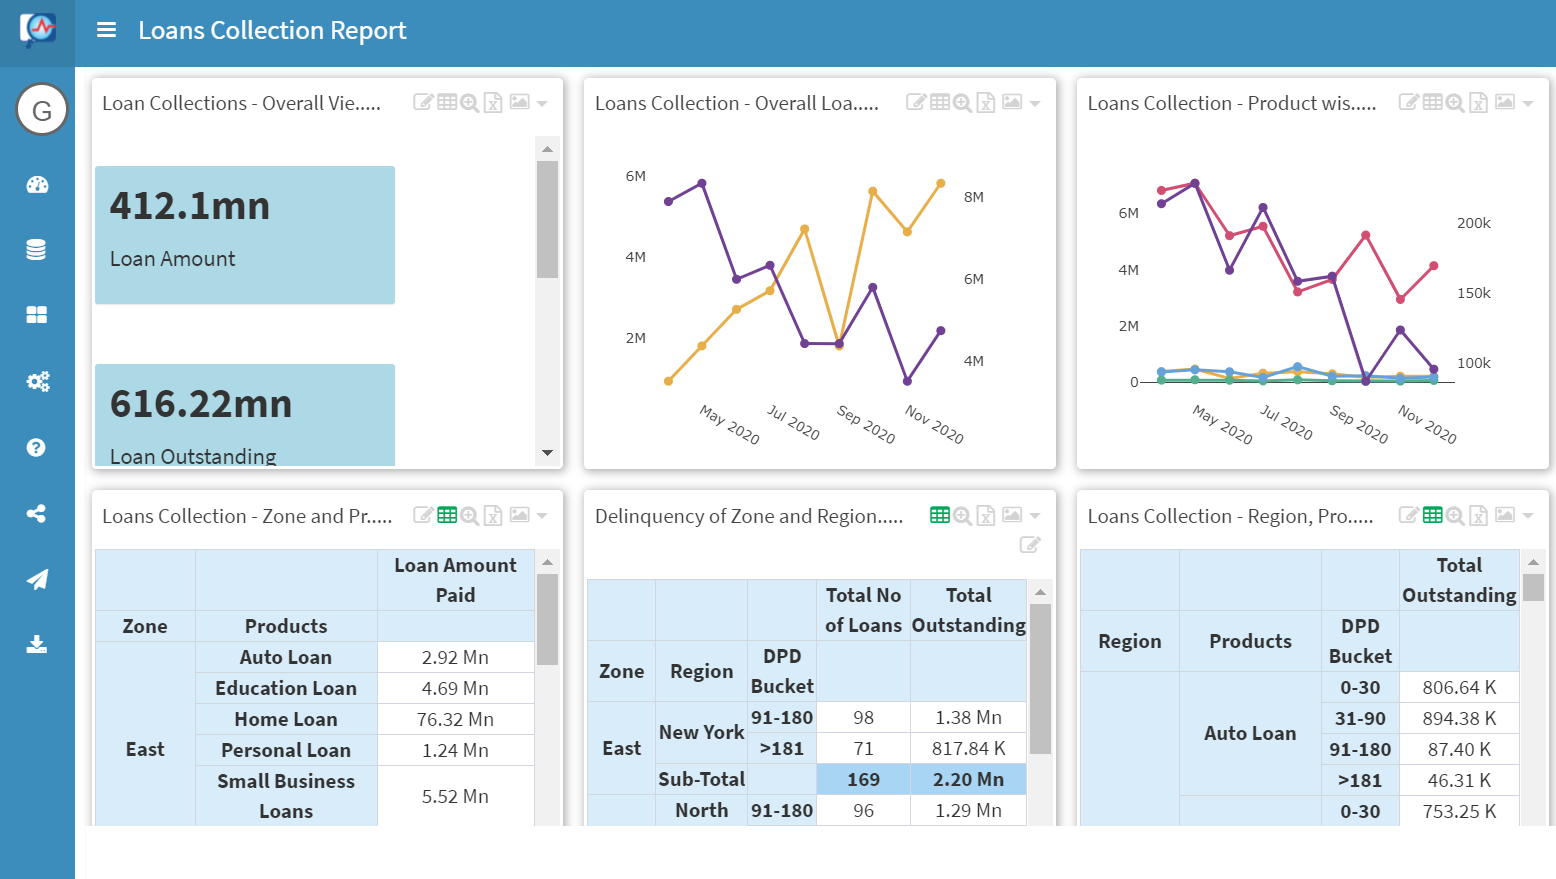
The key benefits of the narrator dashboard is the ability to visualize data anytime, to easily spot trends, to keep track of key performance indicators, and to quickly gain total visibility or snapshots without having to run multiple reports.
Access smart reports and dashboards
Reports and dashboards can be accessed and shared anytime anywhere on real time data. Fine grained permission control can be given to different sets of users/groups such that they will have access to permitted operations. For example, Narrator has a different set of users such as Primary, Explorer and Secondary. Also, output of the reports can be downloaded as excel reports, powerpoint presentation and can be shared as emailers with customised pdf/html reports.
Final Thoughts: Technologies in complete BI Pipeline:
The above mentioned technologies provide benefits and quick wins to the businesses in BI space once they are deployed together. Businesses like banking, insurance, finance, HR, real estate are early adopters of this technology.