
I. LOS, LMS & need of BI Tools:
The most often used systems in the financial world for Banks, NBFCs & Credit Fintech for the lending side are Loan Origination System (LOS)and Loan Management System (LMS). Without these the loans handling process is not possible for most of these organizations. It helps banks, NBFCs, like Improved efficiency, customer acquisition and retention, Better access to customers in underbanked emerging markets, in NBFCs for Improved customer acquisition, underwriting quality, efficiency etc. Let’s first look at what these tools are and then go into the Business Intelligence (BI) use cases for these systems.
Loan Origination System (LOS) – Loan origination is a process by which a borrower applies for a loan, and a lender disburses it or rejects the application. The origination process includes every step from application to funding disbursement, or rejection of the application. The system of automating and managing the loan application and disbursal processes is done through the Loan origination systems.
Loan Management System (LMS) – A loan management system is a digital platform that helps automate every stage of the loan lifecycle, from application to closing. The traditional loan management process is meticulous, time-consuming, and requires collecting and verifying information about applicants, their trustworthiness, and their credibility. Further, the process involves calculating interest rates and supervising payments. A loan servicing software not only automates these procedures but also provides useful analytics and insights for lenders and borrowers.
Business Intelligence (BI) tools – However after the data of loan origination and the final loan data and dump is captured in these systems, the business teams need a strong representative BI and analytics layers which is provided by BI tools.
The process of BI solutions comprises Business Intelligence reporting, online analytical processing, analytics, dashboard development and business performance management. The entire process comprises Data Engineering, Report creation, Interactive tool usage and the automation of the process.
II. BI Setup:
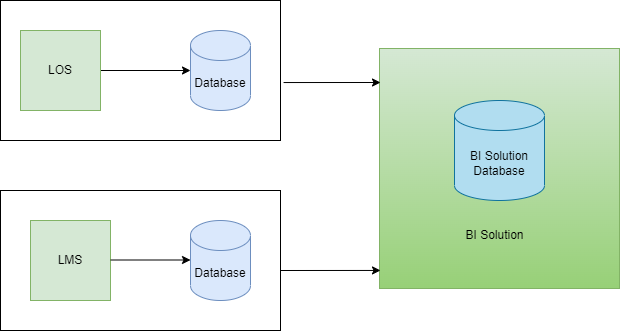
The process of BI system setup involves Data Engineering to report creation to Analytics Dashboards to usage & dashboard automation. This end-to-end BI solution included works with both LOS and LMS systems. Once ETL process is done by a Data Engineers, process in which an ETL tool extracts the data from various data source systems, transforms it in the staging area, and then finally, loads it into the Data Warehouse system.
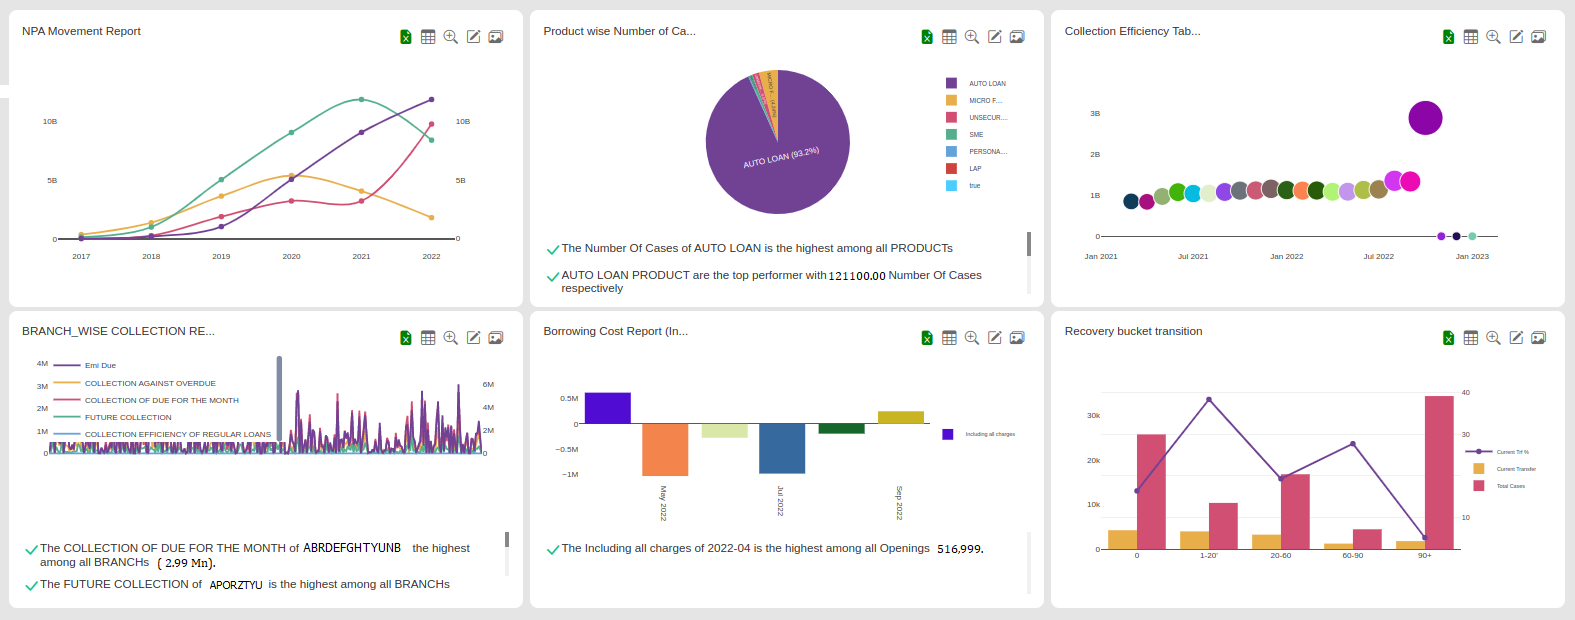
Dashboards are informative, easily readable, usually one page, real-time user interface that shows a visual representation of data using graphs and charts. Dashboards are real time, as when they are pulled up on a web page which is linked to the database the data shown on the dashboard is constantly updated and refreshed. Dashboards show summaries, key trends, comparisons, and insights in both current and historical data. This will help to see at a glance the performance and status of different parts of an organization and to make informed business decisions. Below is the example of how reports and dashboards are created in our BI tool, Narrator:
III. Overall Use cases of the BI tools for Banks, NBFCs and Fintechs :
- Top level reporting for Business Heads for overview of the business
- Update on loan origination and reports
- Sales trackers for Sales heads and sales teams
- Credit Risk teams uses multiple reports for tracking application status, application parameters, scorecards, credit decisions and quality of credit
- Collections reports, collections status & efficiency reports are used by Collections Teams
- Finance & Accounts teams reports for managing the P & L and Balance sheet
IV. LOS & LMS Reports and Dashboards in BI Tools :
A. Some of the LOS – BI Dashboards & Analytics Reports are as follows:
- Loan Underwriting status Reports
- LTV reports
- Loan Disbursement reports
- Customer & application-level analytics
- Sales level loan origination reports
- Broker level loan origination reports
- Product wise organization mix and status reports
- Trend & growth analysis reports for applications & status
- Credit check & Risk assessment reports
- Application scorecard-based analytics reports
- Summary Business Report
- New Business Report
- Daily Loan Case MIS Report
- Weekly and Monthly Application Status Report
B. Some of the LMS – BI Dashboards & Analytics Reports are as follows:
- Daily Loan Balance Report
- Weekly and Monthly Loan Status Report
- Net Interest Margin
- DPD wise POS with Charges
- Collection Efficiency
- LMS – BI Dashboards & Analytics
- Loan Portfolio analytics summary reports
- Behaviour scorecard-based analytics reports
- Vintage reports – Branch wise, Broker wise
- Portfolio mix by product reports
- Portfolio Health reports by status
- Risk status reports
- Collection Efficiency reports
- Delinquency and DPD bucket reports
- NPA reports
- Sales trends and growth analysis summary reports
- PD and ECL reports
- Transfer of Bucket reports
- Fixed Assets & Borrowings reports
- Creditors ageing report
- Debtors ageing report
- Short term and Long-term maturity of portfolio analytics reports
Thus the overall advantages of having BI tools on top of LOS and LMS reports, eliminates human error, prevents delays in payment, centralized data storage, time Saving, Automation for Reports & Dashboards and increase Revenue.
Follow