
Complex Reporting and Dashboard Creation in BI Tools
The process of Business intelligence (BI) solution comprises Business Intelligence reporting, online analytical processing, analytics, dashboard development and business performance management. The entire process comprises Data Engineering, Report creation, Interactive tool usage and the automation of the process.
One significant part of the BI Solution for any Organization is the creation of Complex reports and dashboards as required by the business users. Business intelligence reporting is the process of gathering and analyzing data with the help of modern BI tools. Powered by interactive data visualizations, businesses can extract actionable insights from the data that can be helpful to monitor performance.
These BI Reports aim to allow for the easy interpretation of these large amounts of data. Identifying new opportunities and implementing an effective strategy based on insights that can provide businesses with a competitive market advantage and long-term stability, and help them make strategic decisions.
Business intelligence (BI) Complex Reports: It is a specialized activity and even advanced global BI tools require a specialization in creating those reports with help of Data Engineers, BI specialists and in many cases Data Scientists. They have to write complex SQL queries and Python scripts to create those multi level and complex reports.
ETL process: Once ETL process is done by a Data Engineers, process in which an ETL tool extracts the data from various data source systems, transforms it in the staging area, and then finally, loads it into the Data Warehouse system.
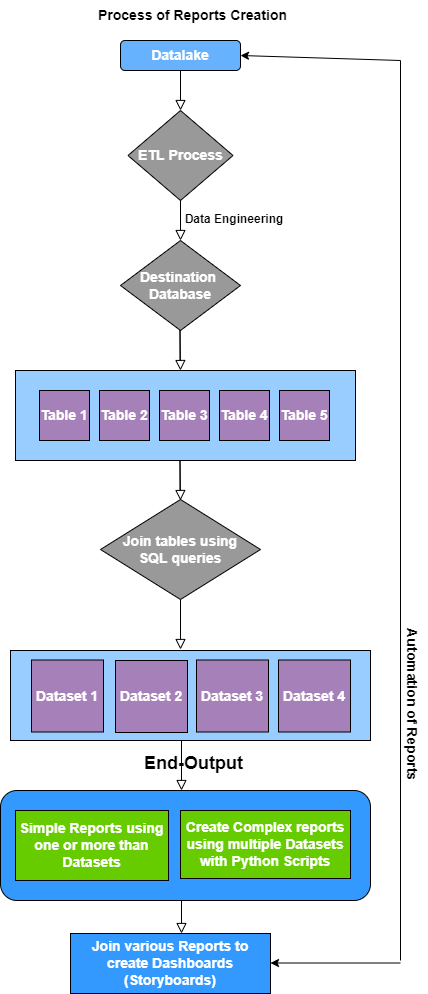
Key Performance Indicator (KPIs) and Dimensions: When we have to create a simpler or complex report user will have to select a data set. In our dataset, data is separated into two parts, one is Dimension and the other is KPI. Dimension will be those data which will have data in string format like name Branch, Product, Scheme, Designation where in KPI data will have only numeric values like sales, transaction value and count etc .
Sometimes just by clicking a few KPI and Dimension we can generate a report but if we require some complex reports then there is need to write some logic for KPI. Like if we want to see business performance for the current month and same month last year at the same time then calculated KPIs can be helpful, we can also create buckets of the kpi (Target Achievement%) to see who comes in which bucket. These calculated KPI’s/Dimensions are created by using simplified SQL queries.
Filters: We can also apply filters on a report for some values. Filters can be applied to dimensions and there is also an option of Condition where users can write conditions to filter out data and make reports out of it.
Report creation process: After data is collected from the end user, reports can be created using these data sets. Sometimes not all data is available in the same data set so by using SQL queries we merge these data sets using some applied logic. If there are some complex KPI’s then those can also be created while merging two or more data sets. Some extra KPI’s can also be created in the Narrator tool using sql commands depending on requirements.
Some reports can be generated using a single data set which can be referred as a simple report, while some are complex and to create them we merge two or more data sets. Sometimes there are more complex reports which need some extra computing which we perform using Python. Proper optimization is done to perform these extra tasks smoothly.
Complex Reports: This process of extracting information from raw data and converting it into appealing visuals like charts, graphs also. BI tools are relatively easy to use, and anyone can use it to create reports and perform data analysis without having much technical knowledge. Reports can be used to check data trends, forecast the data by slicing as per requirements, and can be downloaded in excels, pdf’s etc. We can create different customized reports as required. Here, we combined some existing data which we get from the end user and created a dataset and by using these dataset reports can be created as needed and we can also view it into tabular format or graphs. These reports can also be a drilldown report if there is a hierarchical dataset present in the report. For example, an Insurance company needs to monitor the performance of a four level hierarchy drill down from National head to branch managers in a single report which would indicate the monthly, same month last year, yearly, last year performance using multiple KPI’s.
In advanced tools like our own proprietary Narrator, using one data set, users can create many reports as required along with features of Insights which are derived by NLP programming. By having Insights, it provides users actionable insights on that report.
Dashboards/Storyboards: It is a combination of different reports with self-explaining visualizations for the user. Dashboards can be a summary report, where we create small reports and place them together to see them in one page view. Here also we can see Insights feature which will be generated depending on the report/reports we used to create Dashboards which will be useful for identifying areas of improvement and also any actionable insights This can further also be shared through emails or downloaded in pdf format.
G-Square also provides fully automated end to end BI solutions across industries and various kinds of data problems, Narrator, which is an BI tool to analyze data with different reports which can be helpful in making some important decisions. In Narrator simpler to complex reports are generated, drilldown reports, Insights which visualizes information. It enables the construction of various reports and dashboards and allows access to complete, updated information and supporting managerial processes in the enterprise, becoming essential. It provides all reports and dashboards and set it up in a format as required by the client. All the required reports and dashboards can be accessed through the Narrator.
So while the complex tasks of creating these reports are done by the BI solution providers like G-Square, these reports provide the desired solution to users as an automated solution to their report and insight needs.
Follow