
Background to HR Analytics
HR analytics is better known as workforce analytics and plays a very important role in all the organisation in terms of improving the employee performance and retention. Problem statements which can be answered using HR analytics are :
- Manpower: How to optimize the manpower based on the manning in different locations. Instant alerts and notifications where there is undermanning or over manning.
- Productivity: How to track the required manpower based on the current productivity levels as against the budgets hence leading to optimising the productivity at all levels. Optimized hiring for maximum efficiency is the goal here.
- Attrition Analytics & Retention: Tracking the likely attrition levels based on past trends, employee longevity trends in respective functions, locations etc based on machine learning techniques. Based on that either retention measures could be taken proactively for such employees or future replacement hiring could be planned upfront
- Timing of Hiring: When should we start the hiring process and how many employees will be needed in which field based on the business outlook and current productivity levels
- Scenario analysis: What if analysis where we can check what will be the productivity
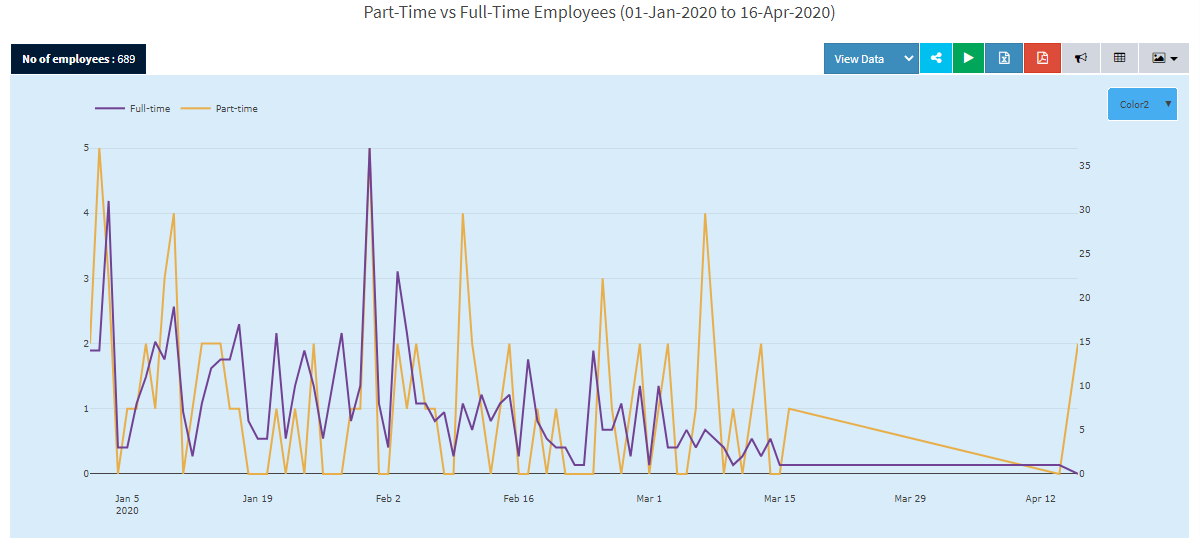
 To perform HR analytics the first step is to gather the routinely collected data like attendance data, manning data, attrition data, productivity data in one place by integrating with different Systems or ERPs being used by the Organisation.
To optimize the manpower we look at different HR analytics metrics such as:
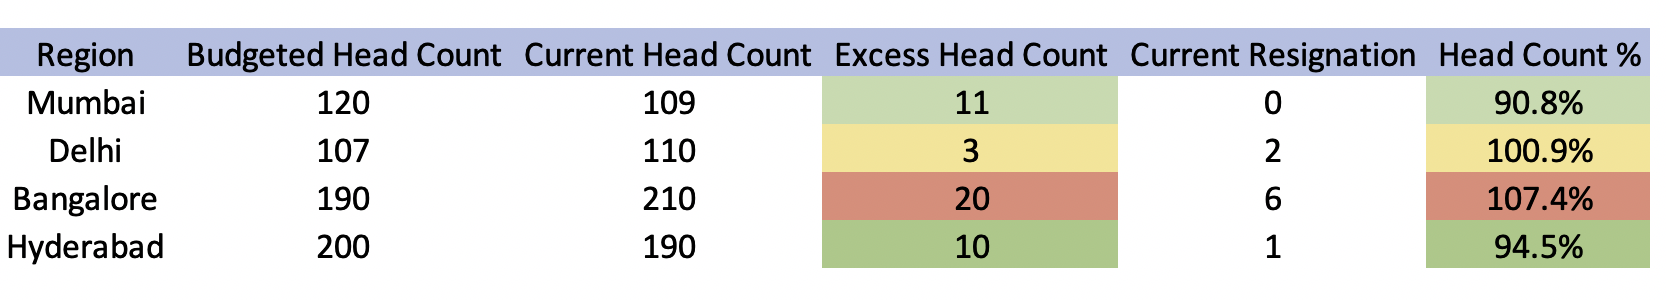
Manning Metrics: We identify patterns and trends in the manning metrics in different regions, branches, work profiles. Manning metrics helps us understand and compare your current manpower and current attrition with the budgeted manpower that is fixed at the start of the financial year. The metrics helps us understand whether we are undermanned or overmanned in various locations and take actinables accordingly.

 Productivity Metrics: It contains the budget fixed at the start of the year, the active headcount of the employees, and target productivity for the financial year. It measures the current productivity with respect to the target productivity and helps identify which locations are not performing well and the reason behind it. For example some locations are undermanned which might cause lower productivity.
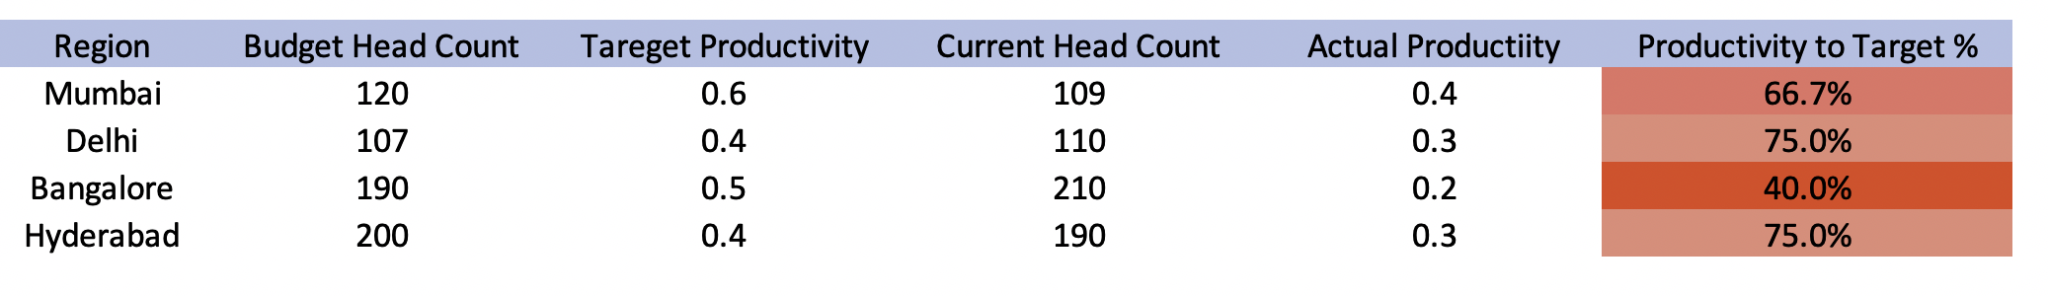
Scenario Analysis: It helps organisations to plan and develop their workforce and also gives more flexibility when thinking about the future and makes everyone aware.
We perform this by creating a what if simulation, which can be done on your productivity metrics or Manning metrics or a combination of both.
For example: what if we want to check what will be the productivity for the remaining financial year if we hire 20 new employees or what should be the headcount/number of employees to reach a target productivity.