
Business intelligence (BI) solutions combine business analytics, data mining, data visualization, data tools and infrastructure, creating data models and helping organizations to make more data-driven. All of these things come together to create a comprehensive view of a business to help people make better and actionable decisions.
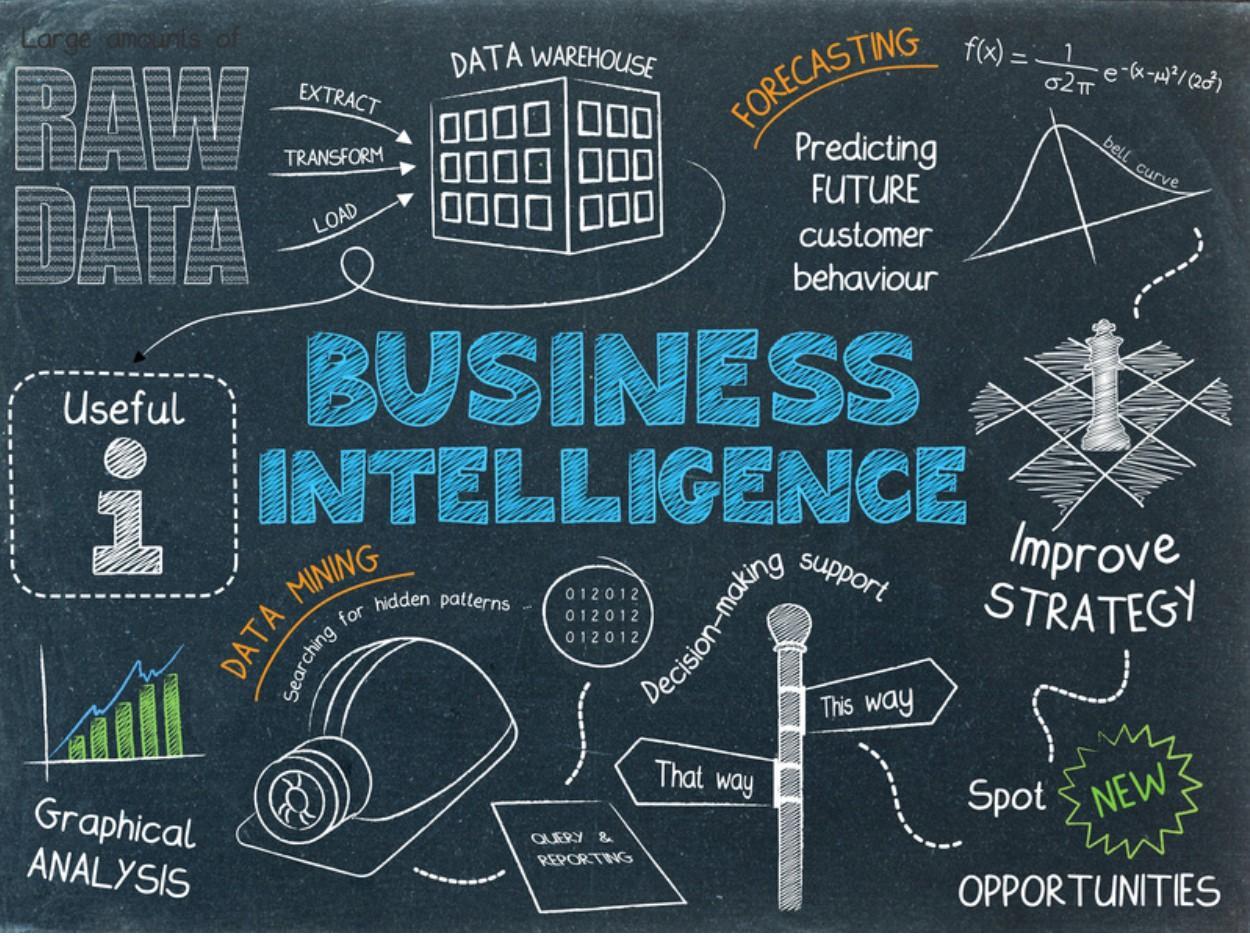 Fig. 1
Why business Intelligence is important:
Business intelligence can help companies make better decisions by showing present and historical data within their business context. Analysts can leverage BI to provide performance and competitor benchmarks to make the organization run smoother and more efficiently. Market Trends can be easily spot to increase sales or revenue. Also, to answer the questions of business organisations and track performance against the goals, necessary data needs to be gathered, analyzed, and determine which actions to take to reach those goals.
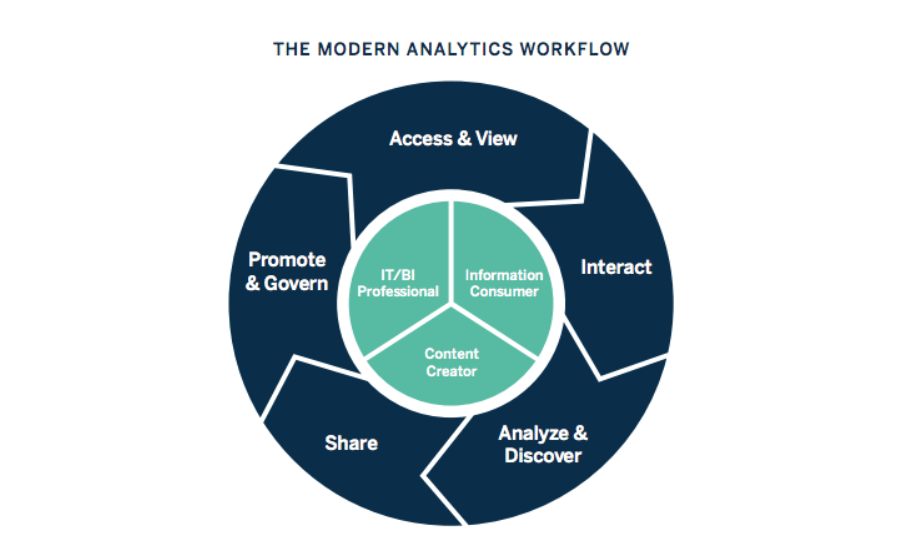
Fig. 2
Here, are the most prominent benefits of BI that will help to solve any business problem:
- Implementation in any department or industry
The possibility that a business intelligence solution has on offer focuses on implementation in any industry, any function, and any data source your company might have or need. That means that a comprehensive overview can be obtained by simply implementing one of the best BI tools for your concrete business case. Nowadays there are BI solutions on the market that every department can benefit from, no matter if the industry is marketing or sales, market research, customer support,fintech, real estate etc.
- Provides real-time monitoring and access to data, anywhere, anytime
Numerous spreadsheets can be automated through creating powerful dashboards accompanied by a number of interactive charts that you can adjust and incorporate with just a few clicks. These dashboards provide access to real-time data, refresh automatically and have interactivity in nature to enable users to simply click on a part of the dashboard, and explore the data further. This is possible thanks to numerous features that enable real-time monitoring and evaluation such as drill-downs, chart filters, time intervals, tooltips, etc.
Process:
- Data Integration: Link multiple databases or data warehouse/mart such as MySQL, PostgreSQL, MsSQL etc. with the tool, compiling multiple data sources, identifying the dimensions and measurements, setup periodic extraction of specified raw tables
- Data Cleaning: Perform data mapping, cleaning transformation and joining different tables
- Reporting and Dashboarding: Using cleaned data, create custom reports and storyboards, compare current performance data to historical data to track performance against goals, typically using customised dashboards
- Automated Emails and Alerts: Automated emails with MIS, reports and analytics dashboards can be sent on a pre-set login and frequency. Even logical alerts based on achieving of a milestone or risk based event can be set up
 Fig. 3
ETL Flow Chart
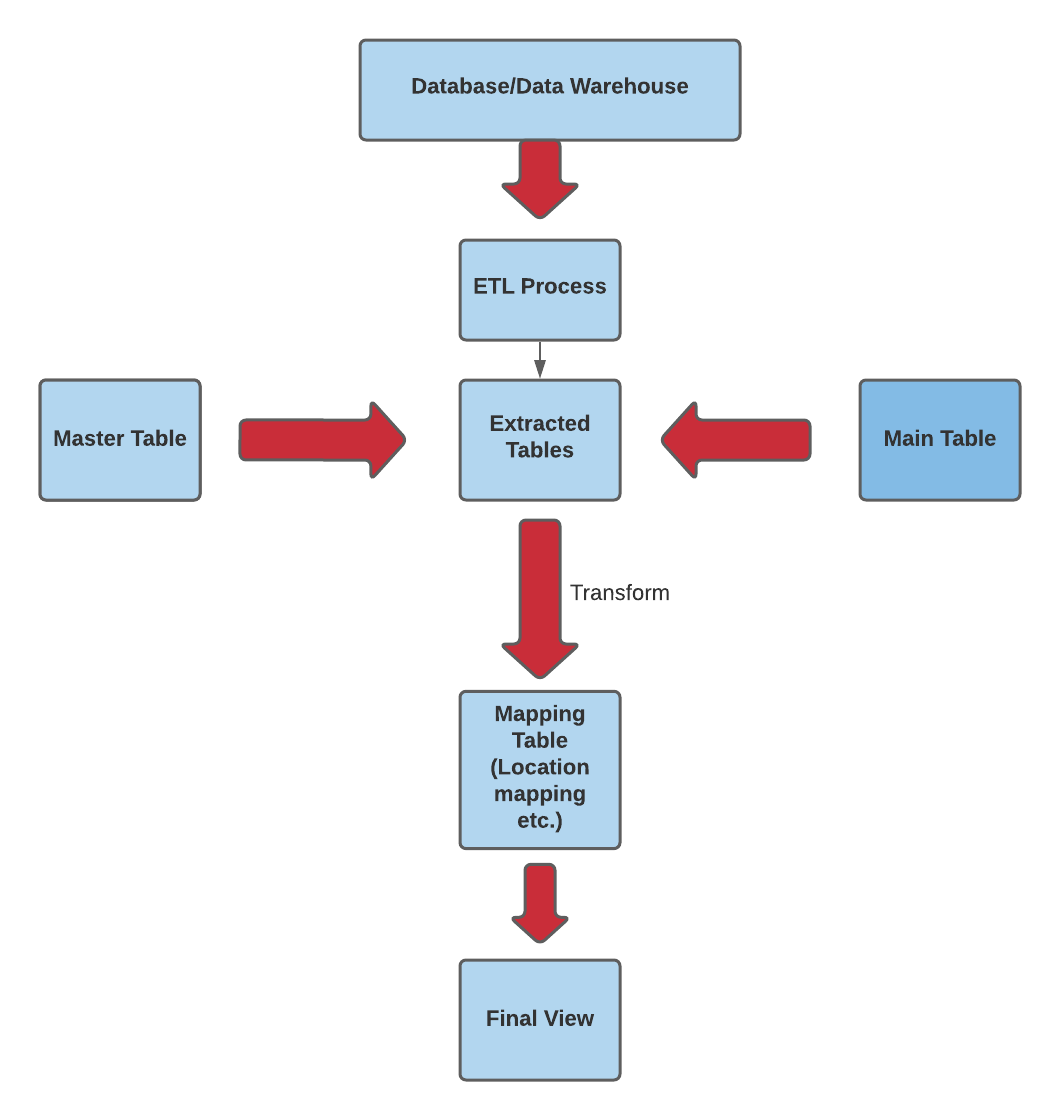
Fig. 4
BI Solutioning with G-Square’s Narrator tool:
G-Square provides end-to-end fully automated BI solutions across Industries and various kinds of data problems through its smart BI solution, Narrator.
Narrator is a descriptive and prescriptive smart BI tool which helps users to get actionable business insights in a smart visualisation, dashboard formats and insights narration in natural language format. It provides users topmost useful insights in a graphical, dashboard and narrative format for the senior management, sales and marketing teams to decide action points to drive business. It also analyzes various business factors individually, multi-level, seasonality, growth and trend analysis on overall and each factor level.
Also, output can be viewed as Saved analysis Report and Dashboards with natural language insights. The output can be downloaded as powerpoint presentation, excel reports and can be shared as customised analytical reports in pdf/html reports.
Narrator Automated Analysis Snapshots:
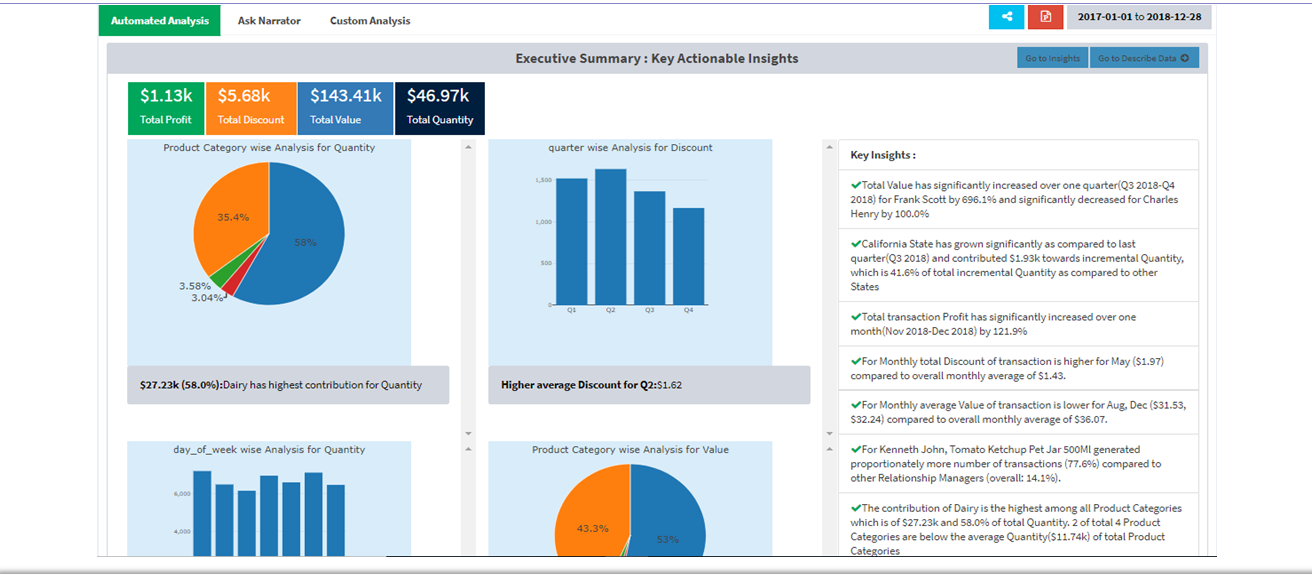
Fig. 5

Fig. 6
Conclusion and future perspective of Business Intelligence:
Business intelligence is continually evolving according to business needs and technology, so each year. We know artificial intelligence and machine learning will continue to grow, and businesses can integrate the insights from AI into a broader BI strategy. As companies strive to be more data-driven, efforts to share data, and collaborate will increase. Data visualization will be even more essential to work together across teams and departments.
BI offers capabilities for near real-time sales tracking, allows users to discover insights into customer behavior, forecast profits, and more. Diverse industries like retail, insurance, and oil have adopted BI and more are joining each year.
Follow