
Automated machine learning, also referred to as automated ML or AutoML, is the process of automating the time-consuming, iterative tasks of machine learning model development.. Creating a Machine-learning/Data Science model from scratch is a time-consuming and long process which has multiple stages and requires multiple iterations. Automating a process like this not only saves time and manpower but also eradicates any human errors that come with working on a long, tedious and iterative process. It is also exhaustive in nature as with creating a model manually, there is always a chance of missing out on some aspect or the other, but an automated process makes sure that everything has been tried, tested, and thoroughly analyzed. We at G-Square achieve AutoML through our product Clientrator.
Features of Clientrator
Clientrator is one such tool that automates the complete process right from doing initial exploratory analysis, finding correlation, choosing and evaluating the right model to using that model to predict data. In addition to automation, this tool also allows the user to use his/her expertise and experience to toggle and control aspects of model creation. This ensures human instincts are taken into account while also saving up a lot of time.
Edit Data
Raw data needs to be processed initially and this section helps the user in editing data in terms of changing the data type of the features. This is an important step as the models treat categorical and numerical data differently and changing the data types can impact model creation.
Descriptive Analysis
In this section, to get a sense of data and the features in it, summary statistics for every feature like mean, median, mode, number of outliers, missing values, unique values, etc. are displayed. This can give an initial indication of the nature of the data at hand and make the user aware of any potential flaws in the dataset.
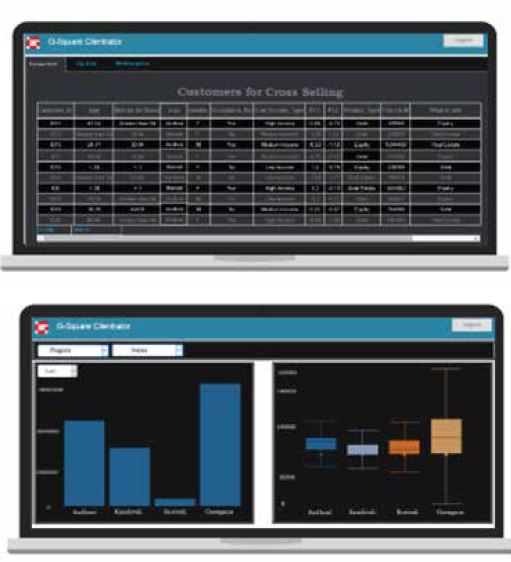
Visualization
Visualizing data can help bring out patterns in data or relationships between various features in the data. Clientrator enables the user to do this by selecting the features and visualizations of choice. Various visualizations like scatter plots, histograms, pie charts, box-plots, etc. can be used depending on the type of features.
Correlation Analysis
In this section, various correlation tests are conducted to determine correlation between all the features in the data. This helps the user in finding out features with multicollinearity or features that don’t really have a high correlation with the feature to predict. And thus, the user can remove these features from the process of model creation so that they don’t impact the model.
Feature Selection
After going through all the processes mentioned above, the user can finally decide what features to use and what features to avoid while creating the model. This is an iterative process wherein the user can always come back and toggle this to impact model creation.
Hyper-Parameters
While creating a model, the user can enter parameters that determine the ways in which a model is created. This will help the user in entering the parameters of his/her choice and tweaking them over iterations to improve model performance.
Parameter Tuning
This feature helps the user in automatically selecting what parameters to use in the model through adopting a grid search method wherein different values of every parameter are passed into the model and their performances are compared, thereby finally using parameters that brought about the best model performance. This process is time-consuming but a more secure way of finding the right parameters for the models.
Cross-Validation
This feature enables the user to perform k-fold cross validation wherein he/she can enter the value of k and for that many amount of times the model data is split into different sets of train and test data. Finally, the performance metrics are averaged out over these iterations. This really helps the user in picking out the model that performs best for their data.
Model Selection
To select the model best suited to the data at hand, Clientrator gives the user the option to run through all
the models and compare their performance with each other through performance metrics like R-square, mean square error, sensitivity, specificity, depending on where it is supervised machine learning or unsupervised machine learning. Additionally, the user also has the option to select the model of his/her choice. This can, in particular, come in handy for experienced users and in turn, improve efficiency.
Hyper-parameters and their effects
Models operate as per the parameters passed into them. There are various parameters that determine various aspects of model performance. A few of the many that are important are max-depth, max-features, minimum samples leaf, etc.
Max-depth is the maximum depth till which the decision tree can be split. Deeper the tree, more will be the number of splits and thus, more information can be gained about the data. In other words, increasing the max-depth can improve model performance but it can also result in overfitting on the training data, so a right balance needs to be found.
Max features is the maximum number of features to consider at every split. More features at every split can help improve model performance but it also decreases the diversity in the model, i.e, the number of features the model is mainly trained on decreases and ideally, we would want the model to learn off of all the important features. It also increases the complexity of the model and hence, it decreases the speed.
Min samples leaf is the minimum number of samples that should be present in the leaf node. Choosin
g a high value prevents overfitting and also helps in increasing the variance in the data, thereby reducing bias. Thus, on a good value, the model takes all the important features into consideration.
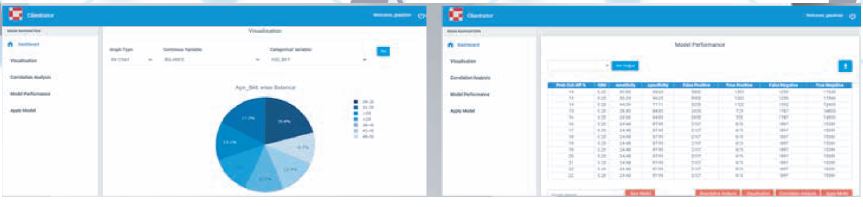
Model Performance and Evaluation
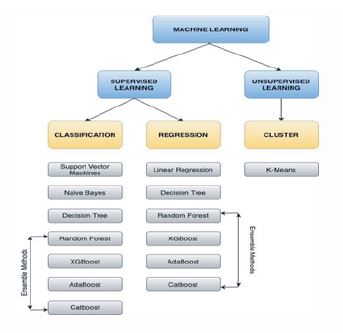
Depending on whether it’s a classification or a regression problem or whether it’s supervised or unsupervised machine learning, different metrics are calculated to evaluate model performance.
For classification, metrics like Gini, Sensitivity, Specificity are good indicators of performance. Gini measures the impurity in terms of misclassifying the data into the wrong class. So it’s a good measure of the accuracy of classification. A lower value means a higher accuracy in classifying and vice versa.
Sensitivity, also known as True Positive Rate, is a measure of the proportion of correctly classified positive results whereas Specificity, is a measure of the proportion of correctly classified negative results. So, in all, these two metrics determine the accuracy in predicting each class in the problem. These metrics are calculated at different probability cut-offs and like this, the optimal cut-off is chosen which is set as a threshold for determining the class.
For regression, R-square, mean absolute error, mean squared error are the metrics that determine the performance of the model. R-square represents the fit of a regression model to the data. It also accounts for the proportion of variance in the dependent variable that can be explained by the independent variables. A positive value of R-square closer to 1 indicates a good fit and a negative value indicates that the model was fitted worse than the average fitted model.
Mean absolute error is the average of absolute differences between the actual and predicted values in the dataset. Thus, it represents the overall error in the model and lower the error, better the fit of the model, and vice versa. And similar to this, root means squared error represents the average of the squared differences between the original and predicted values.

Follow