
Creating Data Views in various environments for complex BI Dashboard Creation
Introduction:
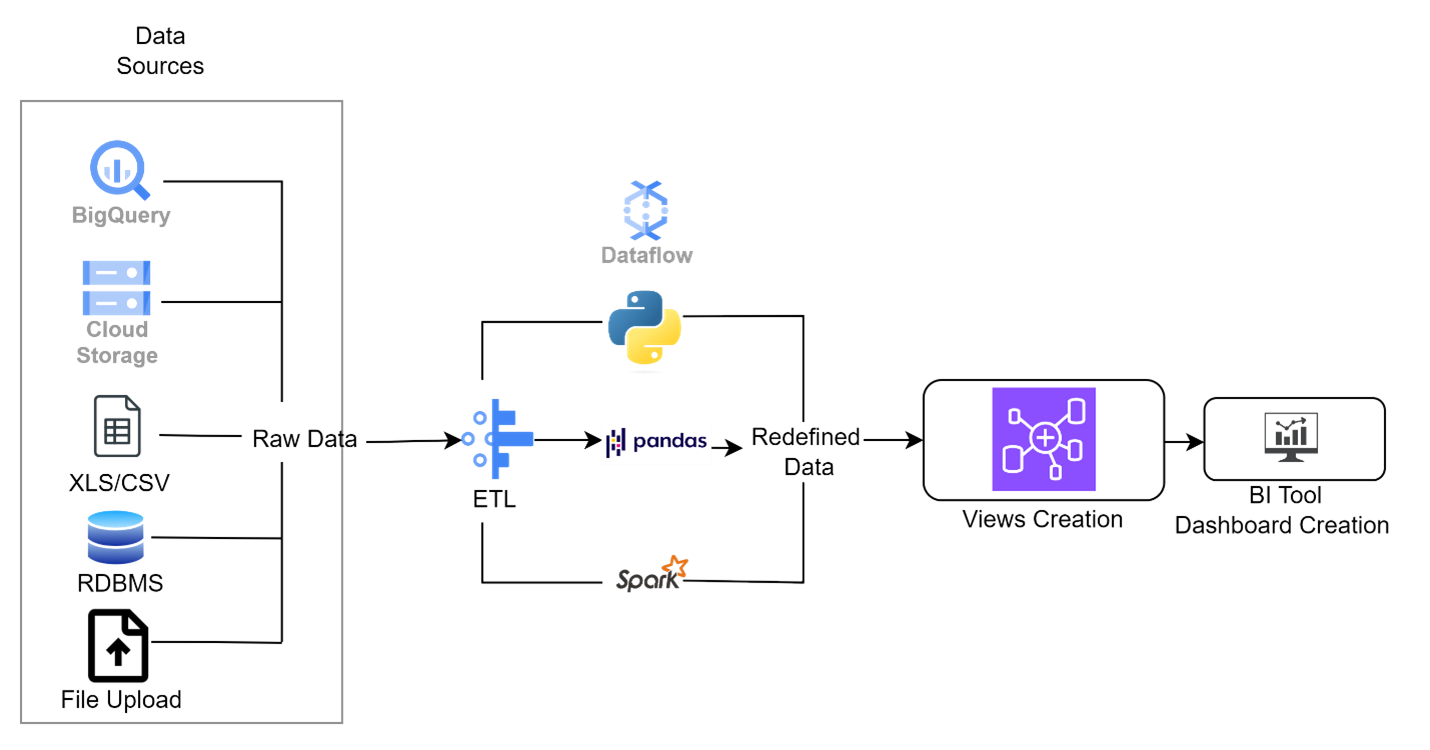
In various BI implementations, we have addressed the need for efficient data pipelines to build complex BI reports from diverse sources. Here’s how we practically implemented robust data pipelines supporting advanced BI dashboards, utilizing cloud platforms like AWS and GCP, as well as on-premise solutions.
The following steps outline the common process for reporting on a data pipeline: Top of Form
Establishing infrastructure, designing pipelines, storing data, and crafting views facilitate a comprehensive data management process.
AWS Implementation:
- We began by establishing AWS services including S3 buckets and RDS instances to store data from POS systems, CRM databases, and online platforms. AWS Glue was configured for seamless data cataloging, enabling easy integration and management of disparate datasets.
- Using AWS Glue and AWS Data Pipeline, we designed ETL workflows automating data extraction, transformation, and loading processes. To ensure scalability and cost-effectiveness, we leveraged AWS Lambda for serverless data processing.
- Amazon Redshift was deployed as the centralized data warehouse for storing and analyzing structured data.Depending on specific requirements, we utilized Amazon Aurora or DynamoDB for semi-structured or unstructured data storage.
- Materialized views within Amazon Redshift were developed to aggregate and summarize data across various dimensions, optimizing query performance for BI dashboards. For ad-hoc querying and analysis, stakeholders were provided with flexible access to data views through Amazon Athena.
GCP Implementation:
- Google Cloud Storage buckets and Cloud SQL instances were provisioned to manage data from diverse sources. Google Cloud Data Fusion or Cloud Composer was configured to orchestrate data pipelines and automate ETL processes.
- Google Cloud Dataflow, leveraging Apache Beam, was utilized for building scalable and resilient data pipelines. Dataflow templates were implemented for common ETL workflows, streamlining development and deployment.
- BigQuery served as the data warehouse solution, providing a fully managed, serverless platform for storing and querying data at scale. For time-series or IoT data, Cloud Bigtable was employed to ensure high performance and low latency.
- SQL queries within BigQuery were defined to create materialized views and virtual tables, enabling efficient data analysis and visualization. Data Studio was used to build interactive dashboards and reports, connecting directly to BigQuery datasets for real-time insights.
On-Premise Implementation:
- On-premise servers or virtual machines were deployed to host databases and data processing tools such as Apache Hadoop or Apache Spark. Network connectivity and security protocols were configured to ensure seamless data transfer and access control.
- Custom ETL scripts or workflows using tools like Apache NiFi or Talend were implemented to meet specific requirements. Data ingestion and transformation tasks were scheduled using cron jobs or scheduling tools to automate the ETL process.
- Relational databases like MySQL or PostgreSQL were set up for structured data storage, ensuring data integrity and ACID compliance. NoSQL databases such as MongoDB or Cassandra were employed for semi-structured or unstructured data storage, providing flexibility and scalability.
- SQL queries or custom scripts were developed to create materialized views and aggregated tables, optimizing query performance for BI dashboards.BI tools like Tableau or Microsoft Power BI were used to connect to on-premise databases and create interactive visualizations and reports.