
Background:
Having extracted data from various Data sources and establishing robust data pipelines and creating comprehensive data views in previous stages, which we covered in our previous edition of Finalytica last month. In this article and in continuation of the process, we delve into building reports & dashboards and extracting actionable insights from the accumulated data.
In this phase, we delve into the process of:
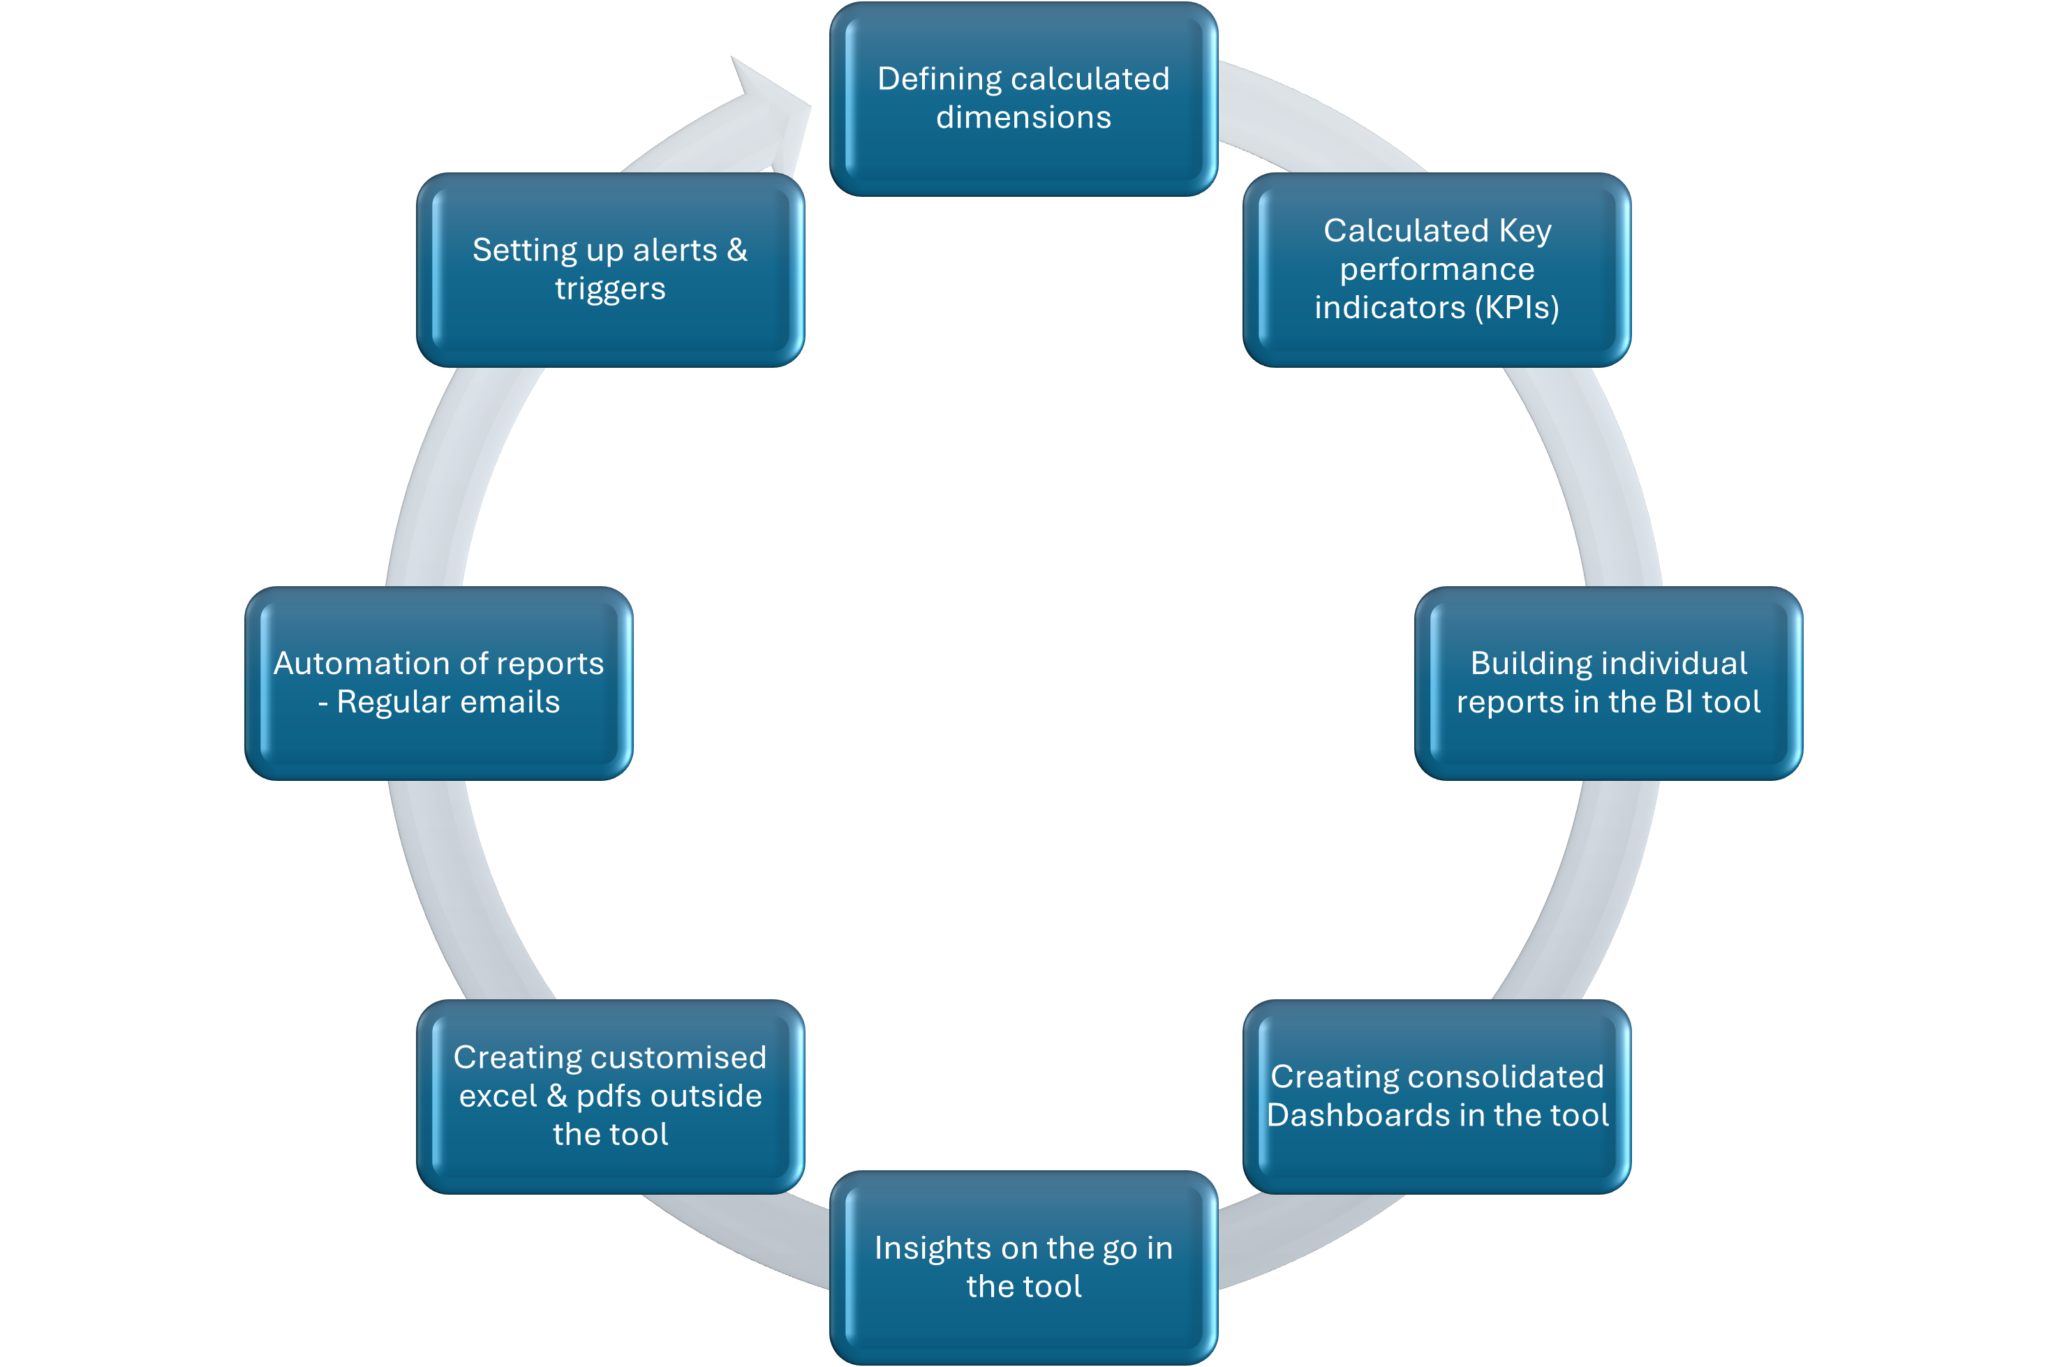
Transforming raw data into actionable insights, highlighting the importance of structured reporting and automated distribution in driving business success. This phase typically involves leveraging SQL queries & Python codes or data manipulation tools within the chosen BI platform to extract, transform, and visualize data according to business requirements.
Moreover, we explore how these reports & dashboards are disseminated to end-users in formats to make informed decision-making, such as Excel or pdf. Automation plays a pivotal role in ensuring timely delivery of reports, allowing stakeholders across the organization to access the latest data seamlessly.
Creating Calculated Dimensions and KPIs:
Using SQL queries & Python code, we can define calculated dimensions and key performance indicators (KPIs) based on the available data views. Calculated dimensions often involve aggregating or manipulating existing dimensions to derive new insights, while KPIs are numerical metrics used to evaluate performance against predefined goals.
For example, in a retail industry scenario, calculated dimensions could include year-over-year growth rates, customer lifetime value, or average order value, while KPIs may encompass metrics such as sales revenue, profit margins, or customer satisfaction scores.
These queries can be customized to the specific needs of the business and can incorporate advanced functions and logic to derive actionable insights from the data.
1. Calculated Dimensions:
Below query creates CIBIL score buckets, which can be used to determine the CIBIL scores of clients. These scores are then used to decide whether to provide a loan or not.
“(Case when “Cibil Score” <= 300 and “Cibil Score” >0 then ‘0-300’ else (Case when “Cibil Score”>300 and “Cibil Score” <= 500 then ‘300-500’ else (Case when “Cibil Score”>500 and “Cibil Score” <= 700 then ‘500-700’ else ‘>700’ end)end)end)”
2. Calculated KPI:
Below SQL query can fetch the growth from year 2018 to 2019 for an organization.
sum(case when date_to_str(“Disbursement Date”,’%Y’) = ‘2019’ then 1 else 0 end) – sum(case when date_to_str(“Disbursement Date”,’%Y’) = ‘2018’ then 1 else 0 end)
3. Creating new Kpi using python code:
Using below python code, the default name of the dataframe from the report will be the result and the default name of the dataframe of the report is output. We created a new KPI called Target conversion which is Conversion that was targeted successfully and based on that we create another KPI ‘ConversionRate’which is the proportion of Target Conversion out of total Conversion.
output=result.fillna(0)
output[‘TargetConversion’] = output.apply(1 if x[‘Target’] == 1 & x[‘Conversion’] == 1 else 0, axis=1)
output[‘ConversionRate’] = (output[‘TargetConversion’] / output[‘Conversion’]) * 100
The default name of the dataframe from the report will be the result and the default name of the dataframe of the report is output. We created a new KPI called Target conversion which is Conversion that was targeted successfully and based on that we create another KPI ‘ConversionRate’which is the proportion of Target Conversion out of total Conversion.
Building Reports, Dashboards and generating Insights
Creating reports and dashboards atop data infrastructure is the cornerstone of transforming raw data into actionable insights. Reports serve as narrative snapshots, distilling complex datasets into digestible formats for decision-makers across the organization. By aggregating, summarizing, and visualizing data using SQL queries and BI tools, we can craft reports that illuminate trends, identify outliers, and quantify performance metrics. Reports could be of many types from trends forecast to bar graph showcasing the revenue across every quarter. ` These reports not only facilitate data-driven decision-making but also foster a culture of transparency and accountability within the organization, enabling stakeholders to align on strategic priorities and track progress towards shared goals.
By consolidating these reports an entire Dashboard can be built, which offer dynamic, interactive interfaces that provide real-time visibility into key performance indicators and business metrics. By integrating data from multiple sources and employing intuitive visualization techniques, dashboards empower users to explore data dynamically, drill down into granular details, and unearth actionable insights with ease. Whether it’s monitoring sales performance, tracking marketing campaigns, or assessing operational efficiency, dashboards serve as command centers for data-driven decision-making, fostering agility and responsiveness in a rapidly evolving business landscape. Combined with automated data refresh mechanisms and customizable alerting functionalities, dashboards ensure that stakeholders stay informed and empowered to make timely, informed decisions that drive business success.
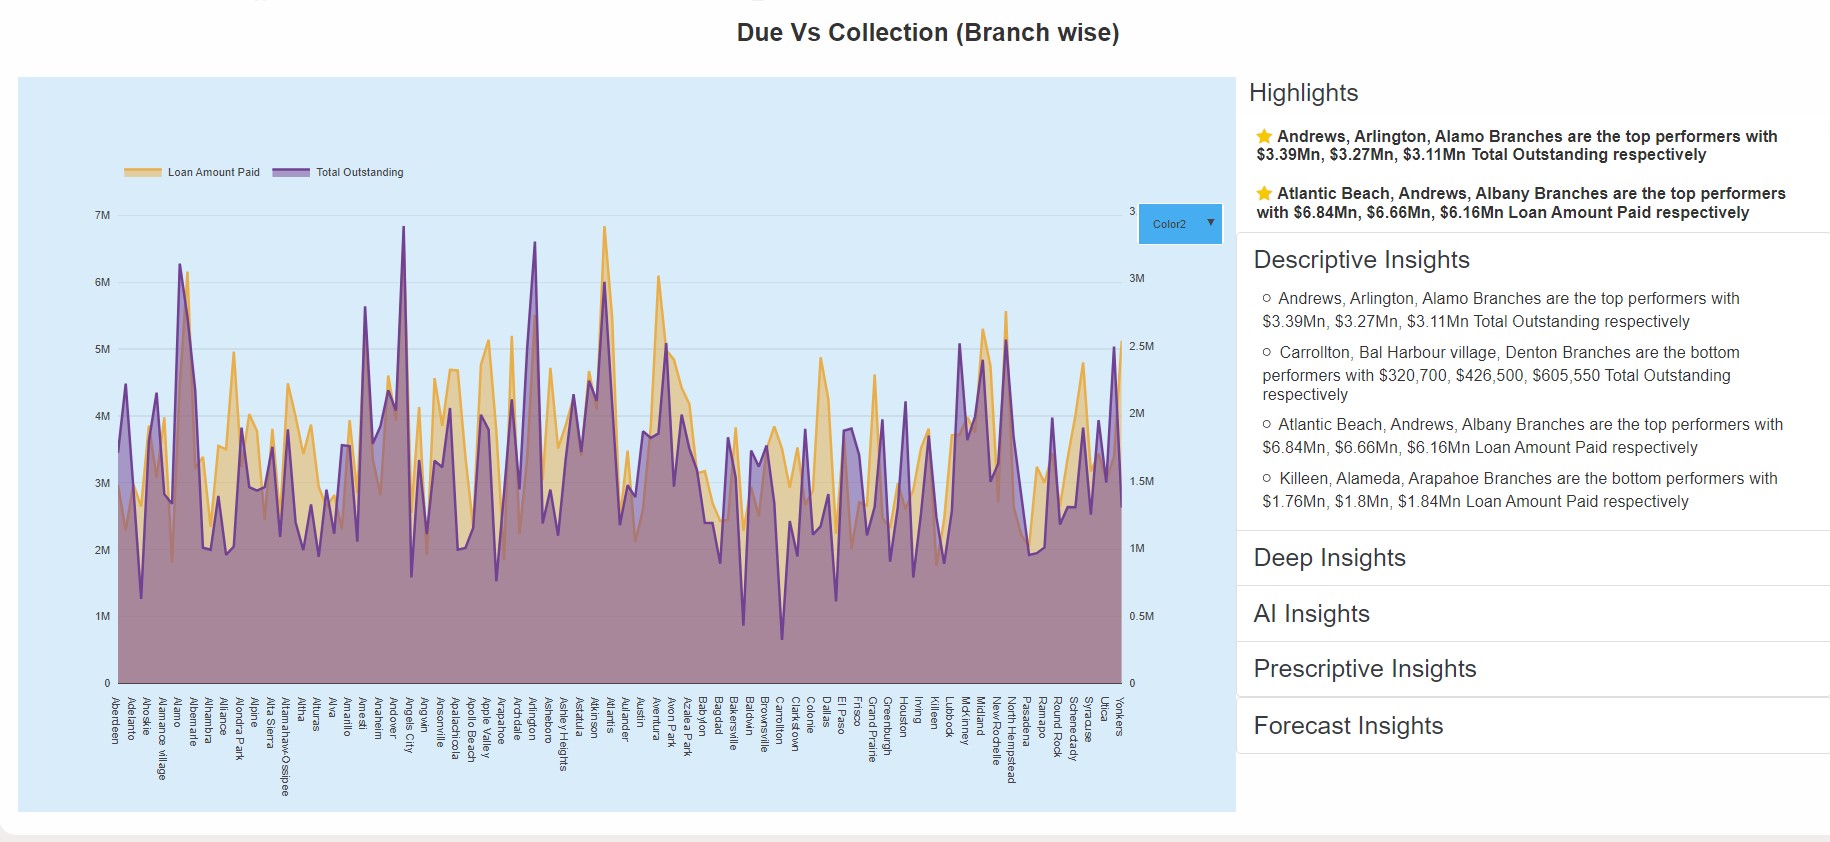
Report
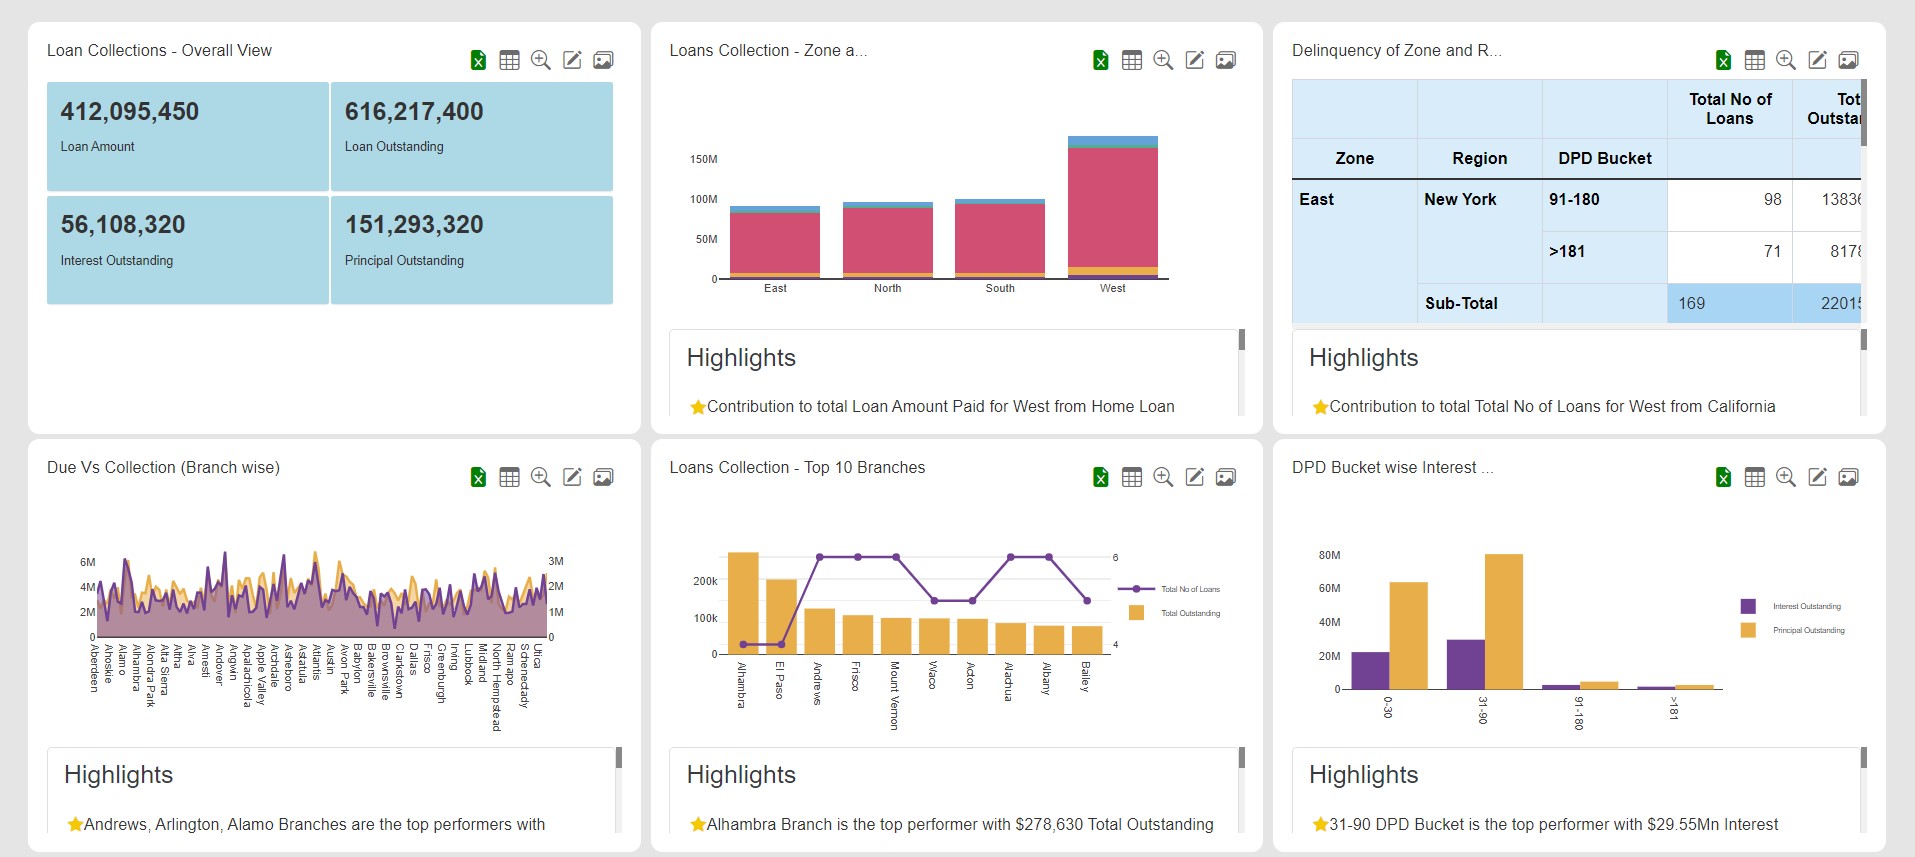
Storyboard
Building customised Excel and pdf reports:
Creating customized Excel and PDF reports is a pivotal step in data access and delivering customized reports & insights directly to stakeholders in formats that are familiar and cater to the specific requirements of the organization..
Excel reports offer a versatile canvas for presenting data in tabular formats, enabling users to manipulate, analyze, and visualize information according to their specific requirements. By leveraging SQL queries to extract relevant data from our views and formatting it into Excel spreadsheets, we can tailor reports to address diverse analytical needs across the organization. Whether it’s financial statements, inventory summaries, or sales forecasts, Excel reports provide stakeholders with the flexibility to explore data at their own pace, perform ad-hoc analyses, and derive actionable insights with ease.
Similarly, PDF reports offer a standardized format for sharing insights and analysis in a concise, portable manner. By designing templates and leveraging SQL queries to populate dynamic content, we can generate PDF reports that encapsulate key findings, trends, and recommendations in a visually compelling format. Whether it’s executive summaries, performance dashboards, or regulatory compliance reports, PDF reports provide stakeholders with a snapshot of critical information, facilitating informed decision-making and collaboration across departments.
Automation of Reports
To streamline the process of report delivery, automation is key. This involves setting up scheduled tasks or workflows to generate and distribute Dashboards at predefined intervals or in response to specific triggers.
For example, reports can be scheduled to be generated and sent out daily, weekly, or monthly, depending on the reporting cadence of the organization. Additionally, alerts or triggers can be configured to notify stakeholders of any significant changes or anomalies in the data. (“An example of an alert in automated report delivery could be setting up a threshold for sales revenue, triggering an alert when it exceeds or falls below a certain predetermined value.
As for triggers, an example could involve detecting a sudden spike in website traffic, prompting the system to generate and distribute a performance dashboard to relevant stakeholders for immediate analysis and action”).
By automating the report delivery process, organizations can ensure that stakeholders have timely access to the latest insights, enabling informed decision-making and driving business success.
Conclusion:
In conclusion, the process of building reports, defining calculated dimensions and KPIs, and delivering insights to end-users is crucial for maximizing the value of a BI implementation. By leveraging SQL queries, automation tools, and user-friendly export formats, organizations can empower stakeholders with actionable insights, driving informed decision-making and driving business growth.
Follow