
Introduction:
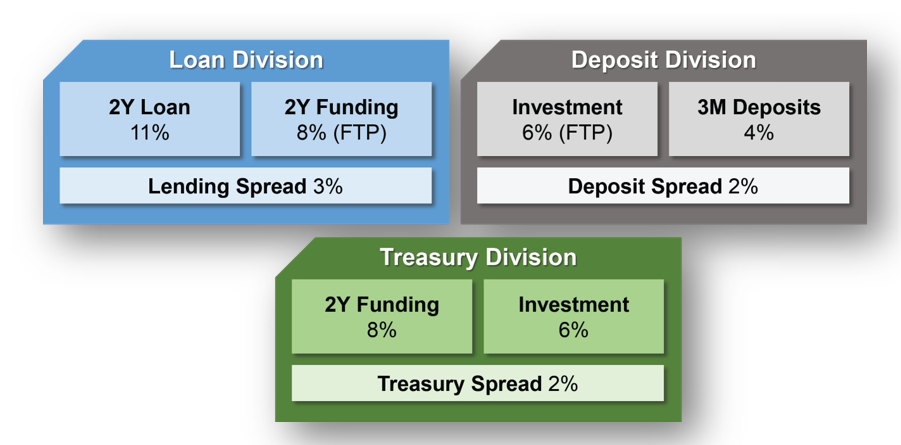
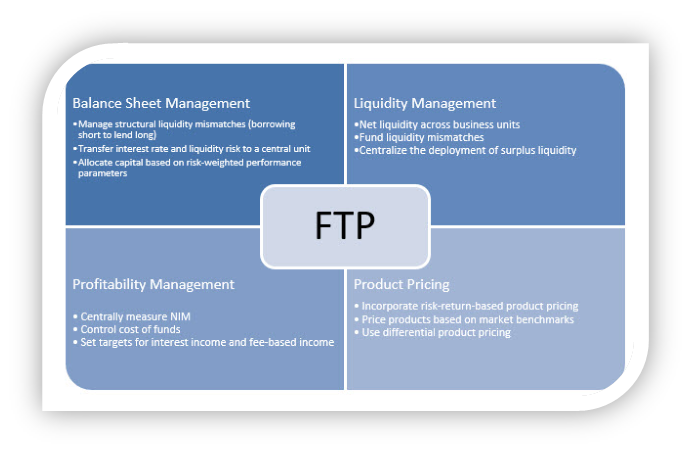
Last year, our Knowledge Series explored the fundamentals of Funds Transfer Pricing (FTP) how banks allocate funding costs, optimize product profitability, and measure true performance across business units.
This year, we are expanding the conversation.
As banking gets more data-driven, profitability can’t be measured by FTP alone. Banks now use combined metrics of earnings, capital, and risk to make better decisions.
Welcome to Knowledge Series 2025, where we deep-dive into the pillars of modern financial performance:
NII, RAROC, Capital Consumption, and Risk-Adjusted Pricing.
Because today’s banks demand answers to tougher questions:
- Which products are actually generating value after adjusting for risk?
- What is the real capital cost behind every loan, card, and liability product?
- How can we measure profitability without ignoring credit, liquidity, and market risks?
- How does data flow from FTP → NII → RAROC to paint a complete performance picture?
📊 Key Topics :
Meaning:
RAROC (Risk-Adjusted Return on Capital) measures how much profit you earn for every unit of risk capital you have deployed. The formulas you shared calculate RAROC for fixed-rate and floating-rate loans.
a) Fixed-Rate Loan
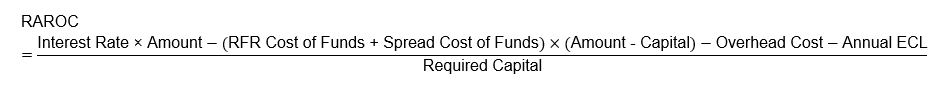
Components Explained:
- Interest Rate × Amount → Total income you earn from the loan.
- RFR Cost of Funds + Spread Cost of Funds × (Amount – Capital) → Cost of funding the loan after deducting the capital set aside.
- RFR Cost of Funds = Risk-free rate used to measure the cost of bank’s funds.
- Spread Cost of Funds = Extra funding cost (10 bps used flat here).
- Overhead Cost → Operational or direct costs (fees, legal, admin).
- Annual ECL → Expected Credit Loss (from IFRS9 system), i.e., anticipated loan defaults.
- Required Capital → Risk capital allocated for the deal (e.g., based on RWA × CAR).
b) Floating-Rate Loan

Difference from Fixed-Rate Loan:
- Uses benchmark rate (SOFR) + spread instead of fixed interest rate.
- RFR is taken until the next reset date (because floating rates change over time).
NII (Net Interest Income) for Various Deals
NII measures the raw interest profitability of a product before adjusting for capital or risk.
| Product Type | NII Formula | Explanation |
| Fixed-Rate Loan | NII = Interest Rate – (RFR + Spread Cost of Funds) | Income from the loan minus the funding cost. |
| Floating-Rate Loan | NII = Deal Benchmark + Spread – (RFR + Spread Cost of Funds) | Similar, but uses benchmark rate for floating-rate loans. |
| Fixed-Rate Liability | NII = (RFR + Spread Cost of Funds) – Interest Expense | Profitability from the liability side. |
| Floating-Rate Liability | NII = Spread Cost of Funds – Spread | Similar to above but floating. |
| Off-Balance Sheet | NII = Annualized Fee Income | E.g., fees from letters of credit or guarantees. |
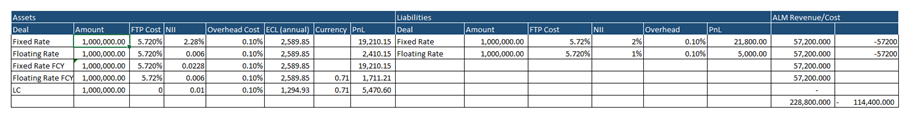
Profitability Attribution (Assets & Liabilities)
This formula combines all income, costs, and risk impacts to calculate the true profitability of an asset or liability:
Components Explained:
- Actual Interest Income → Income booked in GL at deal level.
- Funding Costs × (Average Amount – Capital) → Interest cost of funds adjusted for capital reserved.
- Funding cost = RFR + Spread
- For Savings/Current Accounts, Compounded Overnight Rate (COR) used as RFR.
- Actual Credit Losses → Actual write-offs for the period.
- ECL Movement → Change in expected credit loss (IFRS9) during the period.
- Direct Costs → Costs like insurance, legal, etc.
- Overhead Costs → Operational/admin costs.
- Fee Income → Any income from fees (loan processing fees, off-balance sheet fees).
- Capital → Average RWA × CAR (typically 8%).
Purpose:
- Combines interest income, funding costs, credit risk, and operational costs to determine net profitability of each deal, product, or portfolio.
- Helps pricing, performance evaluation, and risk-adjusted capital allocation.
These formulas NII, RAROC, and profitability attribution are foundational tools for banks to measure, manage, and optimize their products. By calculating NII, banks understand the raw earning potential of loans, deposits, and off-balance sheet products. Incorporating RAROC allows them to evaluate risk-adjusted returns, ensuring capital is deployed efficiently and pricing reflects the risk taken. Profitability attribution further integrates all income, costs, and credit losses to provide a comprehensive view of product-level profitability.
Together, these calculations enable banks to:
- Price products accurately and competitively
- Allocate capital efficiently across portfolios
- Monitor and manage credit, market, and operational risks
- Make informed strategic decisions for growth and sustainability
In short, they transform raw financial data into actionable insights, empowering banks to maximize returns while maintaining a strong, risk-aware balance sheet.
Follow