What is it?
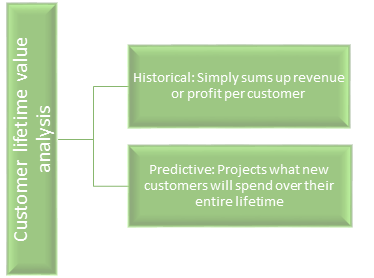
Customer lifetime value analysis is a method to predict how much an organization can benefit from a customer in their entire future relationship. In technical terms it is the “discounted value of future profits generated by a customer.
Why CLTV?
There have always been traditional techniques like Recency, Frequency and Monetary Value (RFM), Past Customer Value (PCV) and Share-of-Wallet (SOW) for segregation of customers into good or bad, but these are not adequate, as they only segment customers based on their past contribution. CLTV on the other hand calculates the future value of a customer over his or her entire lifetime, which means it takes into account the prospect of a bad customer being good in future and hence profitable for a company.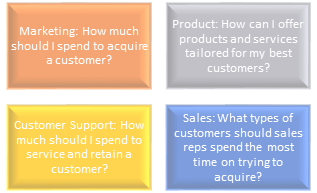
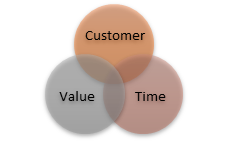
Customer Lifetime Value is the single most important metric for understanding your customers. It helps you make important business decisions about sales, marketing, product development, and customer support.
Machine Learning and CLTV
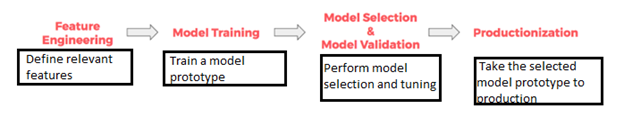
Machine learning simply abstract away the engineering work behind productionizing a model to calculate CLTV. In fact, with such large data involved, one could not put a model into production without ML. There are various ML models available which calculates CLTV like Classification and Regression Trees (CART), Support Vector Machines (SVM), SVM using SMO, Additive Regression, K-Star Method, Multilayer Perceptron (MLP) and Wavelet Neural Network (WNN) etc. Basic model structure is:
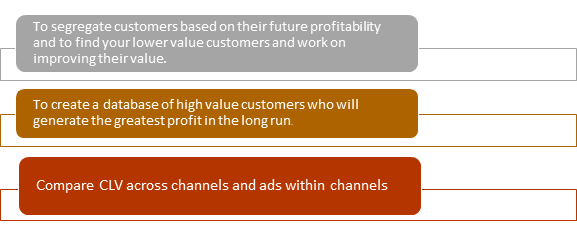
Application of CLTV
Use Case:
Banks need a view of profit/loss at customer level to succeed in acquisition and retention. CLTV is emerging as a tool for banks to be profitable and competitive. We create a customer valuation model which is based on age, lifestyle, demographics, product ownership and activity level as drivers. Our first attempt is to build a RFM model (Recency, Frequency, and Monetary Value). This technique can be readily applied to determine CLV. The technique is simple, intuitive, and does not require a large amount of complicated data.
The potential profitability drivers and their associated items are used as predictor variables in a CART analysis with contribution margin as the target variable. For our analysis, we will rely on ‘contribution margin’ as the target variable, which we defined as revenue resulting from interest payments and commission fees less liquidity cost, equity cost, risk cost and transaction cost covering the bank’s cost of holding cash, maintaining a certain credit risk-dependent equity ratio, accepting the risk of credit loss and carrying out customer-related transactions respectively.